INVITE-ONLY SCRIPT
업데이트됨 Viperz RSI v1.2
The color of the RSI inner bands will change from Purple to Green if RSI >70 and they will change to yellow if RSI >75. Nothing else has been changed from the standard RSI. Please understand I'm testing how publishing indicators works in Trading View. I have only done a minor adjustment to the RSI indicator, but I plan to do much more once I fully understand the publishing process. Thank you. Hope you enjoy. :)
릴리즈 노트
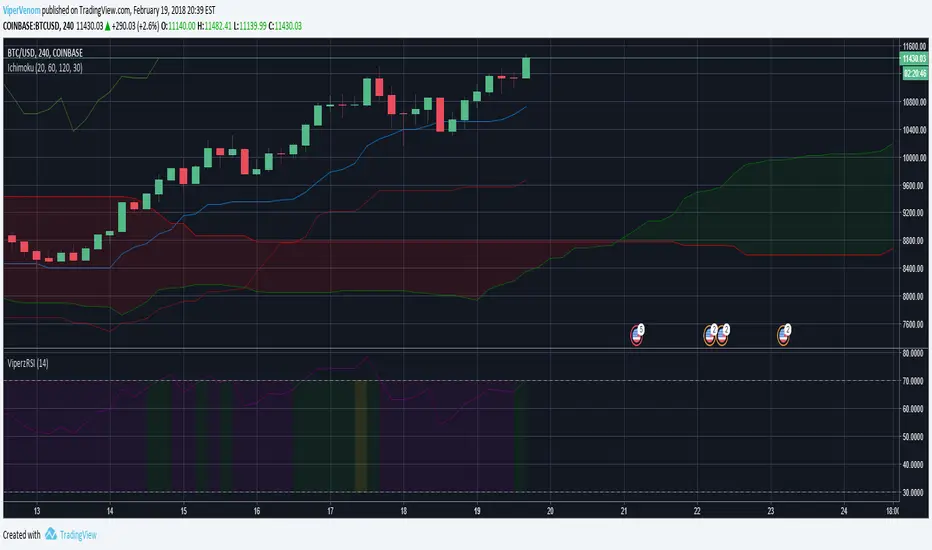
Viperz RSI v1.26As noted previously, I have not changed the RSI formula in any way. You can see it's the same as the built in RSI. The difference is the default coloring and also I have made the color bands change color according to the intervals RSI value.
White is the default if it's within the normal RSI range of 30-70 (which is purple on built in RSI). I think my coloring works extremely well with a black background. The coloring is as follows:
0-20 Yellow
20-25 Light Green
25-30 Green
30-70 WHITE
70-75 Red
75-80 Purple
80-100 Pink
The reason I like this is that it makes overbought and oversold values "pop out" to me at a quick glance. Although this only has visual changes, it is very convenient for me, because I spend less time checking RSI when making use of my quick, easy recognizable color coding.
Changelog from v1.2 to 1.26
* Removed Yellow and Green from overbought. Moved them to oversold instead (Green means buy), and also added Light Green. Added colors Red, Purple and Pink for oversold.
* Made default background White, instead of purple.
* Made default RSI plot line and value (right of title) a nice light blue color that is easily readable.
I'm keeping this script locked, but I will grant access to this for only 0.0005 BTC. Private message me to inquire.
Plans for next release is to use a color gradient. This will add more coloring at different values and go from light to dark/ dark to light in a better way.
초대 전용 스크립트
이 스크립트는 작성자가 승인한 사용자만 접근할 수 있습니다. 사용하려면 요청 후 승인을 받아야 하며, 일반적으로 결제 후에 허가가 부여됩니다. 자세한 내용은 아래 작성자의 안내를 따르거나 ViperVenom에게 직접 문의하세요.
트레이딩뷰는 스크립트의 작동 방식을 충분히 이해하고 작성자를 완전히 신뢰하지 않는 이상, 해당 스크립트에 비용을 지불하거나 사용하는 것을 권장하지 않습니다. 커뮤니티 스크립트에서 무료 오픈소스 대안을 찾아보실 수도 있습니다.
작성자 지시 사항
면책사항
해당 정보와 게시물은 금융, 투자, 트레이딩 또는 기타 유형의 조언이나 권장 사항으로 간주되지 않으며, 트레이딩뷰에서 제공하거나 보증하는 것이 아닙니다. 자세한 내용은 이용 약관을 참조하세요.