OPEN-SOURCE SCRIPT
Price Oscillator TR
### Summary: How to Use the Price Oscillator with EMA Indicator
The **Price Oscillator with EMA** is a custom technical analysis tool designed to help traders identify potential buying and selling opportunities based on price momentum. Here's how to use it:
1. **Understanding the Oscillator**:
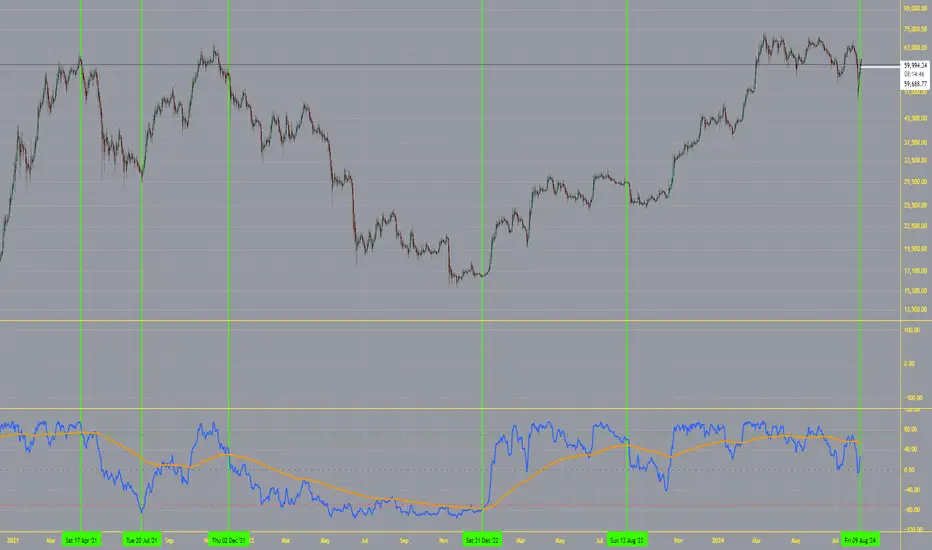
- The oscillator is calculated by normalizing the current price relative to the highest high and lowest low over a specified lookback period. It fluctuates between -70 and +70.
- When the oscillator is near +70, the price is close to the recent highs, indicating potential overbought conditions. Conversely, when it’s near -100, the price is close to recent lows, indicating potential oversold conditions.
2. **Exponential Moving Average (EMA)**:
- The indicator includes an EMA of the oscillator to smooth out price fluctuations and provide a clearer signal.
- The EMA helps to filter out noise and confirm trends.
3. **Trading Signals**:
- **Bullish Signal**: A potential buying opportunity is signaled when the oscillator crosses above its EMA. This suggests increasing upward momentum.
- **Bearish Signal**: A potential selling opportunity is signaled when the oscillator crosses below its EMA. This indicates increasing downward momentum.
4. **Visual Aids**:
- The indicator includes horizontal lines at +70, 0, and -70 to help you quickly assess overbought, neutral, and oversold conditions.
- The blue line represents the oscillator, while the orange line represents the EMA of the oscillator.
### How to Use:
- **Set your parameters**: Adjust the lookback period and EMA length to fit your trading strategy and time frame.
- **Watch for Crossovers**: Monitor when the oscillator crosses the EMA. A crossover from below to above suggests a buy, while a crossunder from above to below suggests a sell.
- **Confirm with Other Indicators**: For more reliable signals, consider using this indicator alongside other technical tools like volume analysis, trend lines, or support/resistance levels.
This indicator is ideal for traders looking to capture momentum-based trades in various market conditions.
The **Price Oscillator with EMA** is a custom technical analysis tool designed to help traders identify potential buying and selling opportunities based on price momentum. Here's how to use it:
1. **Understanding the Oscillator**:
- The oscillator is calculated by normalizing the current price relative to the highest high and lowest low over a specified lookback period. It fluctuates between -70 and +70.
- When the oscillator is near +70, the price is close to the recent highs, indicating potential overbought conditions. Conversely, when it’s near -100, the price is close to recent lows, indicating potential oversold conditions.
2. **Exponential Moving Average (EMA)**:
- The indicator includes an EMA of the oscillator to smooth out price fluctuations and provide a clearer signal.
- The EMA helps to filter out noise and confirm trends.
3. **Trading Signals**:
- **Bullish Signal**: A potential buying opportunity is signaled when the oscillator crosses above its EMA. This suggests increasing upward momentum.
- **Bearish Signal**: A potential selling opportunity is signaled when the oscillator crosses below its EMA. This indicates increasing downward momentum.
4. **Visual Aids**:
- The indicator includes horizontal lines at +70, 0, and -70 to help you quickly assess overbought, neutral, and oversold conditions.
- The blue line represents the oscillator, while the orange line represents the EMA of the oscillator.
### How to Use:
- **Set your parameters**: Adjust the lookback period and EMA length to fit your trading strategy and time frame.
- **Watch for Crossovers**: Monitor when the oscillator crosses the EMA. A crossover from below to above suggests a buy, while a crossunder from above to below suggests a sell.
- **Confirm with Other Indicators**: For more reliable signals, consider using this indicator alongside other technical tools like volume analysis, trend lines, or support/resistance levels.
This indicator is ideal for traders looking to capture momentum-based trades in various market conditions.
오픈 소스 스크립트
트레이딩뷰의 진정한 정신에 따라, 이 스크립트의 작성자는 이를 오픈소스로 공개하여 트레이더들이 기능을 검토하고 검증할 수 있도록 했습니다. 작성자에게 찬사를 보냅니다! 이 코드는 무료로 사용할 수 있지만, 코드를 재게시하는 경우 하우스 룰이 적용된다는 점을 기억하세요.
면책사항
해당 정보와 게시물은 금융, 투자, 트레이딩 또는 기타 유형의 조언이나 권장 사항으로 간주되지 않으며, 트레이딩뷰에서 제공하거나 보증하는 것이 아닙니다. 자세한 내용은 이용 약관을 참조하세요.
오픈 소스 스크립트
트레이딩뷰의 진정한 정신에 따라, 이 스크립트의 작성자는 이를 오픈소스로 공개하여 트레이더들이 기능을 검토하고 검증할 수 있도록 했습니다. 작성자에게 찬사를 보냅니다! 이 코드는 무료로 사용할 수 있지만, 코드를 재게시하는 경우 하우스 룰이 적용된다는 점을 기억하세요.
면책사항
해당 정보와 게시물은 금융, 투자, 트레이딩 또는 기타 유형의 조언이나 권장 사항으로 간주되지 않으며, 트레이딩뷰에서 제공하거나 보증하는 것이 아닙니다. 자세한 내용은 이용 약관을 참조하세요.