OPEN-SOURCE SCRIPT
업데이트됨 MFI Divergence
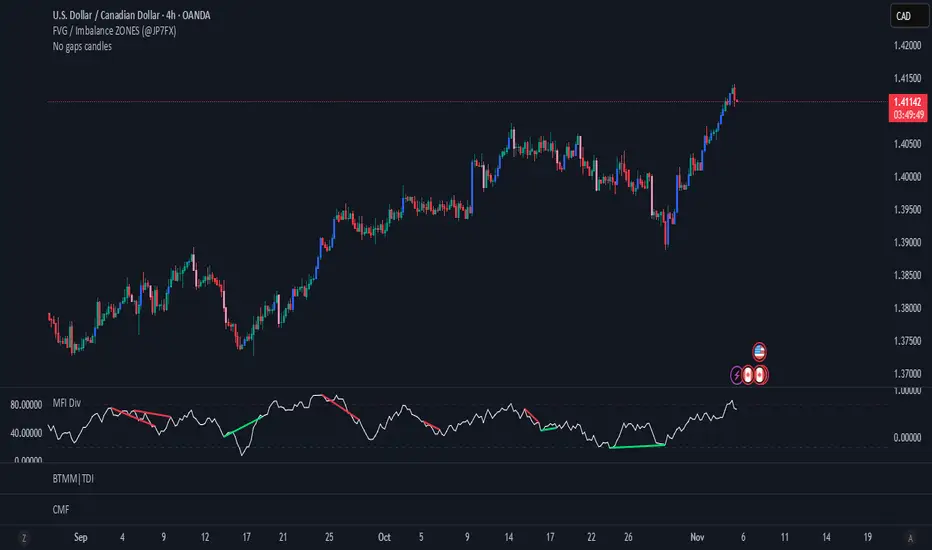
This indicator automatically detects bullish and bearish divergences between price and the Money Flow Index (MFI).
It’s designed for traders who use momentum divergence to anticipate potential trend reversals or continuation traps, and has been optimized to avoid false positives while still catching subtle setups on lower timeframes like 15m.
How It Works
Calculates the Money Flow Index (MFI) using price and volume.
Identifies swing highs and lows on the MFI using adaptive pivot logic.
Compares MFI pivots against corresponding price highs/lows:
Bullish Divergence: Price makes a lower low while MFI makes a higher low.
Bearish Divergence: Price makes a higher high while MFI makes a lower high.
Displays divergences as green (bullish) or red (bearish) lines on the MFI chart.
릴리즈 노트
add center line오픈 소스 스크립트
진정한 트레이딩뷰 정신에 따라 이 스크립트 작성자는 트레이더가 기능을 검토하고 검증할 수 있도록 오픈소스로 공개했습니다. 작성자에게 찬사를 보냅니다! 무료로 사용할 수 있지만 코드를 다시 게시할 경우 하우스 룰이 적용된다는 점을 기억하세요.
면책사항
이 정보와 게시물은 TradingView에서 제공하거나 보증하는 금융, 투자, 거래 또는 기타 유형의 조언이나 권고 사항을 의미하거나 구성하지 않습니다. 자세한 내용은 이용 약관을 참고하세요.
오픈 소스 스크립트
진정한 트레이딩뷰 정신에 따라 이 스크립트 작성자는 트레이더가 기능을 검토하고 검증할 수 있도록 오픈소스로 공개했습니다. 작성자에게 찬사를 보냅니다! 무료로 사용할 수 있지만 코드를 다시 게시할 경우 하우스 룰이 적용된다는 점을 기억하세요.
면책사항
이 정보와 게시물은 TradingView에서 제공하거나 보증하는 금융, 투자, 거래 또는 기타 유형의 조언이나 권고 사항을 의미하거나 구성하지 않습니다. 자세한 내용은 이용 약관을 참고하세요.