OPEN-SOURCE SCRIPT
업데이트됨 SuperTrader Trend Analysis and Trade Study Dashboard
SuperTrader Trend Analysis and Trade Study Dashboard
Overview
This script offers a multi-faceted look at market behavior. It combines signals from different momentum indicators, daily cross checks, and a specialized dashboard to reveal trend strength, potential divergences, and how far price has traveled from its recent averages.
Three Musketeers Method
This script uses a special set of three indicators (the “Three Musketeers”) to determine bullish or bearish pressure on the current chart.
Trend Condition – Compares fast vs. slow EMAs (50 and 200) and checks which side of the line price is favoring.
Mean Reversion Condition – Watches RSI crossing typical oversold or overbought thresholds (e.g., crossing above 30 or below 70).
Bollinger Condition – Checks whether price pushes above/below the Bollinger Bands (based on a 20 SMA + standard deviations).
When at least two out of these three conditions align in a bullish way, the script issues a Buy Signal. Conversely, if at least two align in a bearish way, a Sell Signal is triggered. This “Three Musketeers” synergy ensures multiple confirmations before calling a potential market turn.
Mag 8 Daily Performance
The script tracks eight highly influential stocks (AAPL, AMZN, GOOG, NFLX, NVDA, TSLA, META, MSFT) to see which are green (higher) or red (lower) compared to yesterday’s close. It then prints a quick tally – helpful in gauging overall market mood via these major players.
Golden / Death Cross Signals
On a daily time frame, the script notes when the 50-day SMA crosses above or below the 200-day SMA. A “Golden Cross” often signals rising momentum, while a “Death Cross” can hint at oncoming weakness.
RSI & Divergence Checks
RSI helps identify hidden turning points. Whenever a bullish or bearish divergence is spotted, the script updates you via a concise readout.
Hardcoded Settings
EMA lengths for trend checks, Bollinger parameters, etc., are locked in, letting you focus on adjusting only the pivotal study inputs (e.g., RSI length, VIDYA momentum).
VIDYA Trend Line & Fill
Built on an adaptive Variable Index Dynamic Average, it plots a line that quickly reacts to changing momentum. Users can set a “Trend Band Distance” to mark ATR-based thresholds around that line, identifying possible breakouts or breakdowns.
YoYo Distance
This concept measures how far price strays from SMA(10). If it’s too far, the script colors your display to indicate potential snapbacks.
Gap Up/Down Probability
By weighing volume, MACD signals, and whether price sits above/below its midrange, the script estimates probabilities of a gap up or down on the next daily candle.
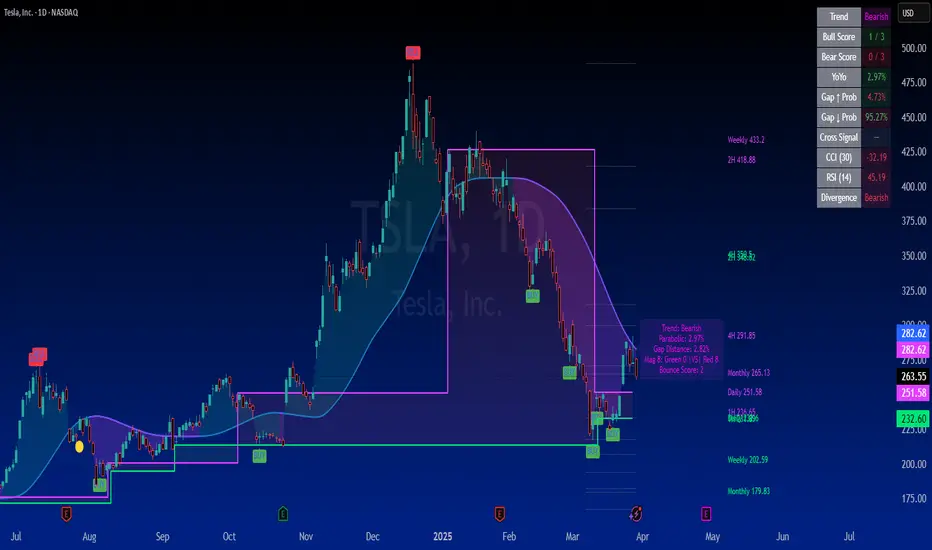
Table Output & Trend Label
Turning on Show Table Widget reveals a quick dashboard on the chart detailing RSI, CCI, divergences, bull/bear scores, and more. A label on the last bar further summarizes overall trend, gap distance, and the Mag 8 snapshot – perfect for a fast read of current market posture.
Use this script to unify multiple signals in one place, see how far price has ventured from typical patterns, and get daily cross signals plus real-time bullish/bearish calls – all at a glance.
Overview
This script offers a multi-faceted look at market behavior. It combines signals from different momentum indicators, daily cross checks, and a specialized dashboard to reveal trend strength, potential divergences, and how far price has traveled from its recent averages.
Three Musketeers Method
This script uses a special set of three indicators (the “Three Musketeers”) to determine bullish or bearish pressure on the current chart.
Trend Condition – Compares fast vs. slow EMAs (50 and 200) and checks which side of the line price is favoring.
Mean Reversion Condition – Watches RSI crossing typical oversold or overbought thresholds (e.g., crossing above 30 or below 70).
Bollinger Condition – Checks whether price pushes above/below the Bollinger Bands (based on a 20 SMA + standard deviations).
When at least two out of these three conditions align in a bullish way, the script issues a Buy Signal. Conversely, if at least two align in a bearish way, a Sell Signal is triggered. This “Three Musketeers” synergy ensures multiple confirmations before calling a potential market turn.
Mag 8 Daily Performance
The script tracks eight highly influential stocks (AAPL, AMZN, GOOG, NFLX, NVDA, TSLA, META, MSFT) to see which are green (higher) or red (lower) compared to yesterday’s close. It then prints a quick tally – helpful in gauging overall market mood via these major players.
Golden / Death Cross Signals
On a daily time frame, the script notes when the 50-day SMA crosses above or below the 200-day SMA. A “Golden Cross” often signals rising momentum, while a “Death Cross” can hint at oncoming weakness.
RSI & Divergence Checks
RSI helps identify hidden turning points. Whenever a bullish or bearish divergence is spotted, the script updates you via a concise readout.
Hardcoded Settings
EMA lengths for trend checks, Bollinger parameters, etc., are locked in, letting you focus on adjusting only the pivotal study inputs (e.g., RSI length, VIDYA momentum).
VIDYA Trend Line & Fill
Built on an adaptive Variable Index Dynamic Average, it plots a line that quickly reacts to changing momentum. Users can set a “Trend Band Distance” to mark ATR-based thresholds around that line, identifying possible breakouts or breakdowns.
YoYo Distance
This concept measures how far price strays from SMA(10). If it’s too far, the script colors your display to indicate potential snapbacks.
Gap Up/Down Probability
By weighing volume, MACD signals, and whether price sits above/below its midrange, the script estimates probabilities of a gap up or down on the next daily candle.
Table Output & Trend Label
Turning on Show Table Widget reveals a quick dashboard on the chart detailing RSI, CCI, divergences, bull/bear scores, and more. A label on the last bar further summarizes overall trend, gap distance, and the Mag 8 snapshot – perfect for a fast read of current market posture.
Use this script to unify multiple signals in one place, see how far price has ventured from typical patterns, and get daily cross signals plus real-time bullish/bearish calls – all at a glance.
릴리즈 노트
New Additions ExplanationBounce Score Calculation:
A new bounce score feature has been integrated. The script now loops through each bounce tracker support/resistance level and checks if the current price is within a defined proximity zone. If so, and if the minimum number of bars between bounces is met, the bounce count for that level is incremented. The level with the smallest difference from the current price determines the current bounce score, which is then dynamically displayed on the trend label.
Dotted SR Lines Feature:
When enabled, the script draws truncated dotted support/resistance lines based on detected pivot levels. These lines are integrated into the overall SuperTrader display, providing a visual reference for key support and resistance levels based on market structure. Additionally, the current bounce score is appended to the trend label for real-time monitoring.
릴리즈 노트
New Input Toggle for Multi-Timeframe LabelsWhat is Added:
A new input option labeled "Show Market Maker Targets" has been incorporated. This toggle allows you to easily enable or disable the display of support/resistance levels from multiple timeframes.
How It Is Useful:
By showing multi-timeframe labels, you can quickly assess key support and resistance levels across different time intervals, providing additional context for your analysis without cluttering the chart.
Multi-Timeframe S/R Section
What is Added:
A new section retrieves support and resistance levels from various timeframes (1H, 2H, 4H, Daily, Weekly, Monthly, Quarterly) using a dynamic function. These levels are then displayed as persistent labels on the chart.
How It Is Useful:
Displaying these levels allows you to view significant price levels from alternate timeframes at a glance, which can enhance your overall analysis by providing broader market context.
Dynamic Support and Resistance Lines
What is Added:
The indicator plots dynamic support and resistance levels using lime and purple lines, respectively. These lines are based on the "sandwich" candle logic and adjust dynamically with the market data.
How It Is Useful:
The dynamic support (purple) and resistance (lime) lines provide real-time key levels derived from current market behavior. They help traders identify potential reversal or breakout points by highlighting areas where the price has historically found support or encountered resistance.
These updates collectively add layers of functionality to your indicator by enhancing its visual guidance through both multi-timeframe labels and dynamic S/R lines.
릴리즈 노트
Table was not updating in Realtime. Table now updates with each bar. 릴리즈 노트
[u]SuperTrader Update: New Features Added[/u][LIST]
* Average Daily Move Calculation (Daily Chart)
This new metric calculates the average daily price range over the last 20 days.
- Displayed in both % and point value.
- Formula: (High - Low) / Close * 100
- Example: [color=green]2.01% / 5.23 pts[/color]
- Added directly below the Mag 8 summary in the trend label.
* MACD Signal (10-Minute Chart)
A fast MACD signal from the 10-minute timeframe now appears in the stats table.
- [color=green]Bullish[/color] if MACD line > Signal line.
- [color=blue]SUPERBULL[/color] if both MACD and Signal lines are above -0.25.
- [color=red]Bearish[/color] if MACD line is below Signal line.
- Dynamically updates in the final row of the table widget.
* Visual Enhancements
- Uses noticeable color coding: [color=blue]Blue[/color] for SUPERBULL, [color=green]Green[/color] for Bullish, [color=red]Red[/color] for Bearish.
- Ensures quick interpretation from table at a glance.
[/LIST]
These additions make your dashboard more predictive, time-sensitive, and visually intuitive for identifying short-term momentum and market dynamics.
릴리즈 노트
Neutral MACD State (New Addition)A new [color=yellow]Neutral[/color] state has been added to the 10-minute MACD logic in the dashboard table. This state provides a subtle cue when momentum is weakening but not yet bearish.
Logic Conditions:
- The MACD fast line is below the slow line (so not bullish).
- But both the MACD line and the Signal line are still above -0.025.
Why this matters:
This helps distinguish:
- True bearish signals (when MACD is falling deeper)
- From indecisive or consolidating markets that are holding slightly above zero momentum.
Visual Cue:
- The table displays \"Neutral\" in [color=yellow]yellow[/color] to highlight this cautious, non-directional state.
This enhancement gives you a more refined look at market momentum before full bear conditions emerge.
릴리즈 노트
Adjusted Margins.릴리즈 노트
Divergence updated to display the current divergent condition only. and hold that indication for 10 bars after condition is found. Then Divergence will return to a None condition if no current divergence is found. Divergence will dynamically update as opposed to displaying the last divergent state constantly. 릴리즈 노트
Added color option to change S&R dotted line color. May not show up one some charts by default as dotted S&R lines are grey by default. 릴리즈 노트
Optimized the Table. Added 3 rows to monitor custom timeframes on the trend. Custom timeframes are watching for price above the low MA's and MacD status to confirm trend. Default for TF1 is 1minute, TF2 is 5min, TF3 is 15Min. Timeframe can be changed at the bottom of the settings
릴리즈 노트
re-added S&R lines after accidental removal. 릴리즈 노트
Changed TF Trend in the table to TF PA to accurately represent "Price Action" status for the chosen frame릴리즈 노트
VIX Price and Volume Monitor
VIX is like a weather report for the stock market. It tells us how much volatility is coming into the market. When the VIX number is very high (80 or more), our script shows a special message instead of just the number. This special message helps remind us that things are moving very fast or unusually.
Volume Monitoring for User-Entered Symbols
Volume tells us how many shares are being traded—imagine it as counting the number of kids playing a game. We keep track of the average volume over the past 20 days (this average is called the baseline). Today's volume is then compared with this baseline:
- [] If the volume is around the baseline, we call it "Normal" and show it in white.
[] If the volume is a bit lower—specifically, if it’s lower than the baseline divided by 1.5—we call it "Low Vol" and display it in red.
[] If the volume is even lower—meaning it is less than half of the baseline—we call it "Melt" and show it in yellow.
[] On the flip side, if the volume is higher than usual (up to 1.5 times the baseline), it is called "Elevated", and if it’s much higher, it will be "Unusual".
Why is Volume Monitoring Important?
Volume monitoring is important because it shows us how active a stock is. When many shares are traded, that means there is lots of interest or concern about the stock—like a game with many players. Low volume, on the other hand, might tell us that not many people are paying attention to it. This information can help make better decisions about when to buy or sell, or just help understand the market mood.
User Symbol Entry
In the script, there are two input boxes labeled Ticker 1 and Ticker 2.
You type in a symbol (for example, "AAPL" for Apple).
The script then looks at how many shares are being traded for that symbol and compares it to its 20-day average volume.
It then displays a label (like "Normal," "Low Vol," or "Melt") with a specific color to show if the volume is normal, lower than normal, or very low.
This helps you quickly see if trading activity is less than what is usually expected, which might be a clue about the market’s behavior.
[endquote]
릴리즈 노트
Correction made to avoid ConcurrentModificationError릴리즈 노트
Added MacD settings. Tied them into all features that rely on MacD. Default is now 20/40/5릴리즈 노트
YoYo Table value now colors appropriately to show Extended/Extreme moves from the designated moving average in comparison to the user defined threshold. Default is 3%릴리즈 노트
Corrected issue where buy/sell labels were made transparent in the last patch. Added setting to turn them on or off. 릴리즈 노트
Organized Settings menu. Added color adjustments. Highlight Impulse Channels on Dynamic S/R Lines.릴리즈 노트
Added Dynamic DayTrader Channel. A simple yet powerfully effective dynamic trend channel that connects the previous Day H/L to the current day H/L. Current day will Anchor at 1200 hours or at the most recent HH/LL and no longer dynamically adjust. From here the projection channel will take over. Perfect for day trading.
릴리즈 노트
Added a hardcoded 10 SMA릴리즈 노트
Highlight Impulse channels set to defvalue false릴리즈 노트
Added Heartline to DayTrade Channels. Can be toggled on or off and color adjusted. 릴리즈 노트
Added Monthly & Quarterly Anchored VWAP.오픈 소스 스크립트
트레이딩뷰의 진정한 정신에 따라, 이 스크립트의 작성자는 이를 오픈소스로 공개하여 트레이더들이 기능을 검토하고 검증할 수 있도록 했습니다. 작성자에게 찬사를 보냅니다! 이 코드는 무료로 사용할 수 있지만, 코드를 재게시하는 경우 하우스 룰이 적용된다는 점을 기억하세요.
All opinions while deemed valid by its operators and shared on this board are not financial advice and are primarily for Entertainment Purposes.
면책사항
해당 정보와 게시물은 금융, 투자, 트레이딩 또는 기타 유형의 조언이나 권장 사항으로 간주되지 않으며, 트레이딩뷰에서 제공하거나 보증하는 것이 아닙니다. 자세한 내용은 이용 약관을 참조하세요.
오픈 소스 스크립트
트레이딩뷰의 진정한 정신에 따라, 이 스크립트의 작성자는 이를 오픈소스로 공개하여 트레이더들이 기능을 검토하고 검증할 수 있도록 했습니다. 작성자에게 찬사를 보냅니다! 이 코드는 무료로 사용할 수 있지만, 코드를 재게시하는 경우 하우스 룰이 적용된다는 점을 기억하세요.
All opinions while deemed valid by its operators and shared on this board are not financial advice and are primarily for Entertainment Purposes.
면책사항
해당 정보와 게시물은 금융, 투자, 트레이딩 또는 기타 유형의 조언이나 권장 사항으로 간주되지 않으며, 트레이딩뷰에서 제공하거나 보증하는 것이 아닙니다. 자세한 내용은 이용 약관을 참조하세요.