PROTECTED SOURCE SCRIPT
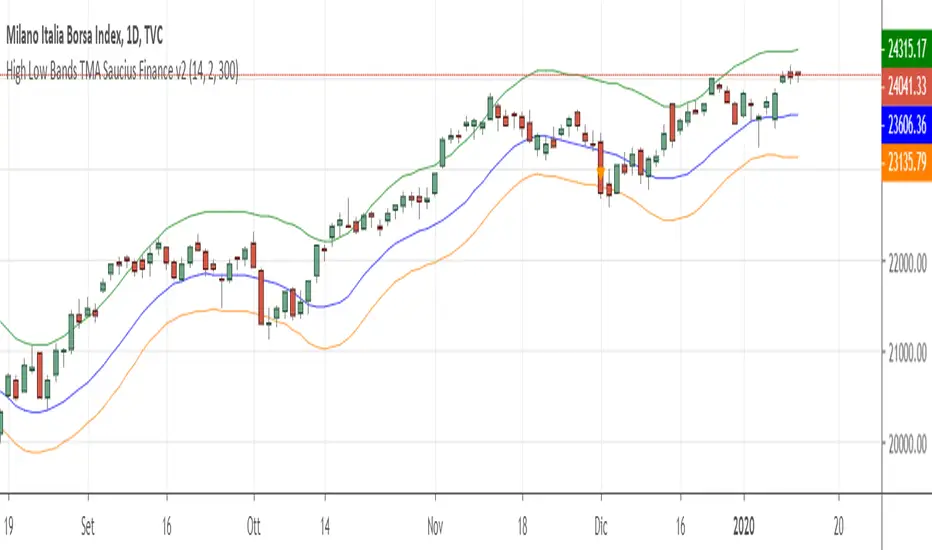
High Low Bands Triangular Moving Avg Saucius Finance v2

Bands based upon triangular bands are more precise and quicker than those which use Bollinger’s method (simple moving average), Keltner’s one, Highs and lows and so on.
Just enter long when prices cross over “middleband” and go short viceversa. As filter the color of the signal’ candle must be coeherent with your next position (price shall go down if you want to go short and viceversa).
Upper and lower bands are the target: close the position when price undergo the upper band (or High band) in case of long and when price overcome the lower one (Low band) in case of short. Frequently price have a retracement towards middleband: for being safe, open another long position again (after the previous one) if the close is higher than the upper band (lower than the lower band in case of short).
K is only a factor to determine the distance of the middleband to the lower one (since Big stock markets tends always to grow, short is less interesting).
You can use my indicator in all temporal frame for many (not all!) financial instruments.
I recommend in particular to use Heiken-Ashi figure (but you can use the standard one). For a quick (but not hysteric) trading, use graph 30′ to open position, and wait the next bar for a confirm. As second filter, simply open position coerehent with the daily graph (I meanif in daily desk signal is long, do not open short position in the 30 minutes’ one).
Contact me for any explanation and watch my site!
보호된 스크립트입니다
이 스크립트는 비공개 소스로 게시됩니다. 하지만 이를 자유롭게 제한 없이 사용할 수 있습니다 – 자세한 내용은 여기에서 확인하세요.
면책사항
해당 정보와 게시물은 금융, 투자, 트레이딩 또는 기타 유형의 조언이나 권장 사항으로 간주되지 않으며, 트레이딩뷰에서 제공하거나 보증하는 것이 아닙니다. 자세한 내용은 이용 약관을 참조하세요.
보호된 스크립트입니다
이 스크립트는 비공개 소스로 게시됩니다. 하지만 이를 자유롭게 제한 없이 사용할 수 있습니다 – 자세한 내용은 여기에서 확인하세요.
면책사항
해당 정보와 게시물은 금융, 투자, 트레이딩 또는 기타 유형의 조언이나 권장 사항으로 간주되지 않으며, 트레이딩뷰에서 제공하거나 보증하는 것이 아닙니다. 자세한 내용은 이용 약관을 참조하세요.