OPEN-SOURCE SCRIPT
업데이트됨 Zone Strength [wbburgin]
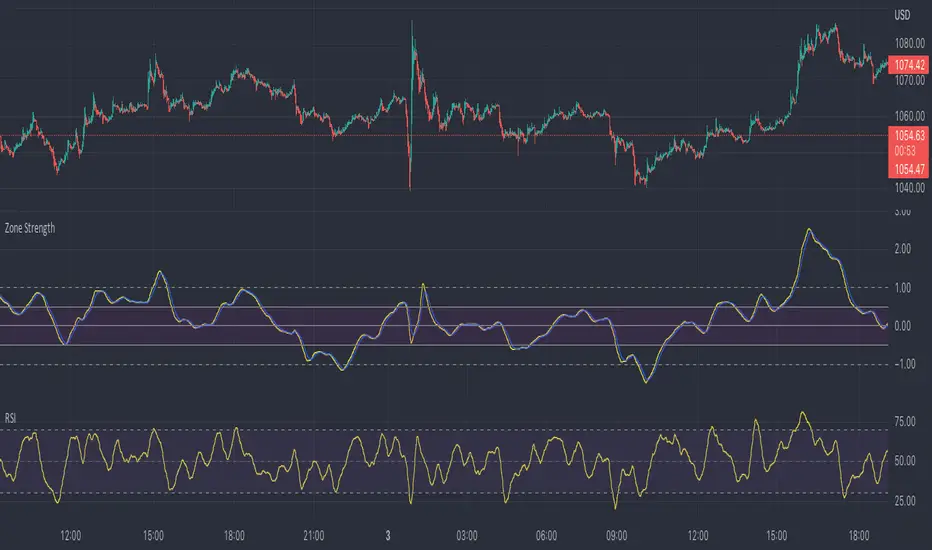
The Zone Strength indicator is a multifaceted indicator combining volatility-based, momentum-based, and support-based metrics to indicate where a trend reversal is likely.
I recommend using it with the RSI at normal settings to confirm entrances and exits.
The indicator first uses a candle’s wick in relation to its body, depending on whether it closes green or red, to determine ranges of volatility.
The maxima of these volatility statistics are registered across a specific period (the “amplitude”) to determine regions of current support.
The “wavelength” of this statistic is taken to smooth out the Zone Strength’s final statistic.
Finally, the ratio of the difference between the support and the resistance levels is taken in relation to the candle to determine how close the candle is to the “Buy Zone” (<-0.5) or the “Sell Zone” (>0.5).
wbburgin
릴리즈 노트
Option to not show tertiary resistance lines (and make the plot appear easier to see).릴리즈 노트
Ease-of-use update! Added a bunch of customizable MA features and made the interface easier to change.오픈 소스 스크립트
트레이딩뷰의 진정한 정신에 따라, 이 스크립트의 작성자는 이를 오픈소스로 공개하여 트레이더들이 기능을 검토하고 검증할 수 있도록 했습니다. 작성자에게 찬사를 보냅니다! 이 코드는 무료로 사용할 수 있지만, 코드를 재게시하는 경우 하우스 룰이 적용된다는 점을 기억하세요.
FAQ: I am gradually phasing out my Patreon because of the time it takes to maintain.
BTC: 35PdMMMXFCvPjXKwn8wsRFNwMEPgStaKUJ
Test my strategies on CryptoRobotics: cryptorobotics.co/?trade=f23b09
BTC: 35PdMMMXFCvPjXKwn8wsRFNwMEPgStaKUJ
Test my strategies on CryptoRobotics: cryptorobotics.co/?trade=f23b09
면책사항
해당 정보와 게시물은 금융, 투자, 트레이딩 또는 기타 유형의 조언이나 권장 사항으로 간주되지 않으며, 트레이딩뷰에서 제공하거나 보증하는 것이 아닙니다. 자세한 내용은 이용 약관을 참조하세요.
오픈 소스 스크립트
트레이딩뷰의 진정한 정신에 따라, 이 스크립트의 작성자는 이를 오픈소스로 공개하여 트레이더들이 기능을 검토하고 검증할 수 있도록 했습니다. 작성자에게 찬사를 보냅니다! 이 코드는 무료로 사용할 수 있지만, 코드를 재게시하는 경우 하우스 룰이 적용된다는 점을 기억하세요.
FAQ: I am gradually phasing out my Patreon because of the time it takes to maintain.
BTC: 35PdMMMXFCvPjXKwn8wsRFNwMEPgStaKUJ
Test my strategies on CryptoRobotics: cryptorobotics.co/?trade=f23b09
BTC: 35PdMMMXFCvPjXKwn8wsRFNwMEPgStaKUJ
Test my strategies on CryptoRobotics: cryptorobotics.co/?trade=f23b09
면책사항
해당 정보와 게시물은 금융, 투자, 트레이딩 또는 기타 유형의 조언이나 권장 사항으로 간주되지 않으며, 트레이딩뷰에서 제공하거나 보증하는 것이 아닙니다. 자세한 내용은 이용 약관을 참조하세요.