PROTECTED SOURCE SCRIPT
업데이트됨 [TG] Complete Financial Data
HISTORY & CREDITS
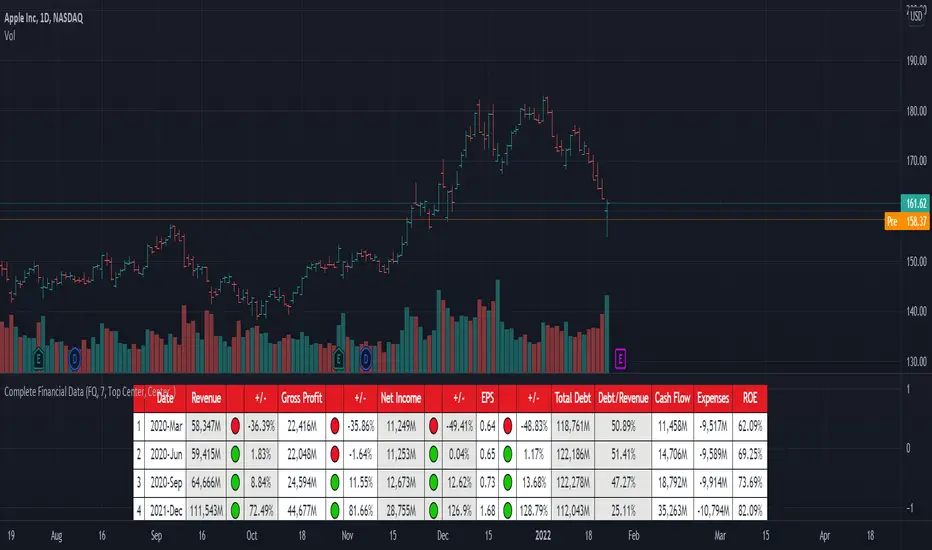
Complete Financial Data is basic, yet very effective tool, that will show the most important information from the company's latest financial statements at a glance.
WHAT IT DOES
The table is designed to show comprehensive financial data about the selected ticker.
HOW TO USE IT
Even if you are entirely a technical analyst, it's always a good practice to take a look at the company's fundamentals, in order to understand more about the heath of the business. Look for companies that beat expectations and show positive growth numbers.
Complete Financial Data is basic, yet very effective tool, that will show the most important information from the company's latest financial statements at a glance.
WHAT IT DOES
The table is designed to show comprehensive financial data about the selected ticker.
- Revenue - often referred to as sales or the top line, is the money received from normal business operations.
- Gross profit, also called gross income, is calculated by subtracting the cost of goods sold from revenue.
- Net income, also called net earnings, is calculated as sales minus cost of goods sold, selling, general and administrative expenses, operating expenses, depreciation, interest, taxes, and other expenses.
- Earnings per share (EPS) is calculated as a company's profit divided by the outstanding shares of its common stock. The resulting number serves as an indicator of a company's profitability.
- Total debt includes long-term liabilities, such as mortgages and other loans that do not mature for several years, as well as short-term obligations, including loan payments and accounts payable balances.
- The debt-to-revenue ratio is a financial measure that compares a company's monthly debt payment to its monthly gross income.
- The term cash flow refers to the net amount of cash and cash equivalents being transferred in and out of a company. Cash received represents inflows, while money spent represents outflows.
- An expense is the cost of operations that a company incurs to generate revenue. As the popular saying goes, “it costs money to make money.”
- Return on equity (ROE) is a measure of financial performance calculated by dividing net income by shareholders' equity.
HOW TO USE IT
Even if you are entirely a technical analyst, it's always a good practice to take a look at the company's fundamentals, in order to understand more about the heath of the business. Look for companies that beat expectations and show positive growth numbers.
릴리즈 노트
Update: Improved header design.보호된 스크립트입니다
이 스크립트는 비공개 소스로 게시됩니다. 하지만 이를 자유롭게 제한 없이 사용할 수 있습니다 – 자세한 내용은 여기에서 확인하세요.
면책사항
해당 정보와 게시물은 금융, 투자, 트레이딩 또는 기타 유형의 조언이나 권장 사항으로 간주되지 않으며, 트레이딩뷰에서 제공하거나 보증하는 것이 아닙니다. 자세한 내용은 이용 약관을 참조하세요.
면책사항
해당 정보와 게시물은 금융, 투자, 트레이딩 또는 기타 유형의 조언이나 권장 사항으로 간주되지 않으며, 트레이딩뷰에서 제공하거나 보증하는 것이 아닙니다. 자세한 내용은 이용 약관을 참조하세요.