OPEN-SOURCE SCRIPT
Market Forecast w/ Signals [QuantVue]
The Market Forecast With Signals Indicator is an upgraded version of the popular ThinkorSwim platforms Market Forecast. This upgraded version utilizes stochastic oscillators, moving averages, and momentum calculations to find potential buying and selling opportunities.
Stochastic Oscillator
The indicator calculates three variations of the Fast Stochastic Oscillator for different time periods:
🔹Intermediate: Calculated over a medium-term period (default 31 bars).
🔹Momentum: Calculated over a short-term period (default 5 bars).
🔹Near Term: Calculated over a very short-term period (default 3 bars).
These calculations involve finding the highest and lowest values within their respective periods and comparing the current close to this range.
Moving Average Smoothing
The results of the Fast Stochastic Oscillator for the Intermediate and Near Term are then smoothed using a Simple Moving Average (SMA):
🔹Intermediate: 5-period SMA of the Intermediate Stochastic Oscillator.
🔹Near Term: 2-period SMA of the Near Term Stochastic Oscillator.
Momentum Indicator
A custom momentum calculation is performed, using the recent high and low prices over four periods.
Display
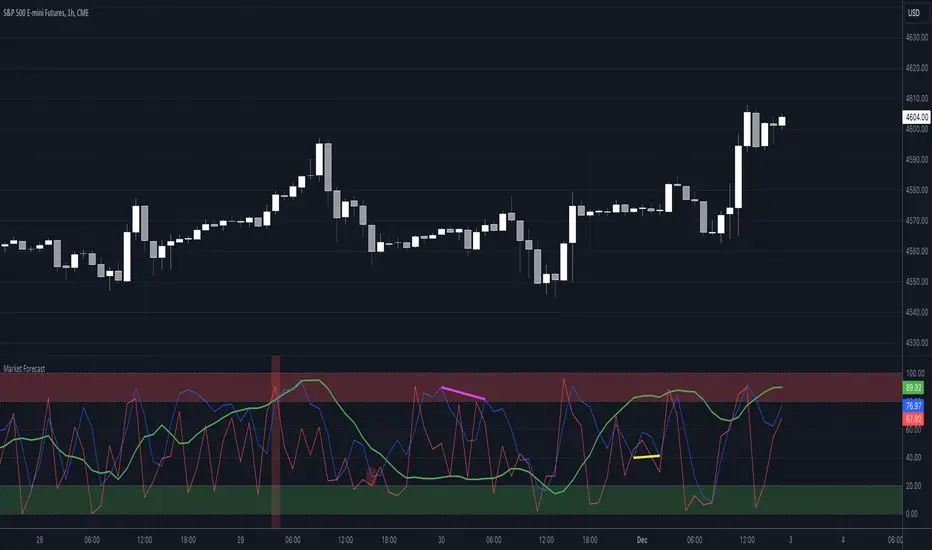
The indicator plots the smoothed Intermediate, Near Term, and custom Momentum calculations as separate lines on the chart.
Trading Signals
While the original indicator plots the lines mentioned above, the Market Forecast w/ Signals goes a step further by identifying key moments when nuanced signals fire. The built in alerts and visual aids make spotting these trading opportunities a breeze.
Clusters - Bullish and Bearish clusters are identified based on the convergence of all three lines (Intermediate, Near, and Momentum) above 80 (Bearish) or below 20 (Bullish).
The background color of the chart changes to indicate these clusters, aiding in quick identification of market extremes.

Trend Reversals - Marked with labels on the chart, this is based on the direction of the cluster (bullish or bearish) and the subsequent price movement crossing a threshold determined during the cluster formation.

Divergences - Divergences between the Near Term line and price highs/lows are detected using pivot points. These divergences are then plotted as lines on the chart, highlighting potential discrepancies between price action and momentum, which can signal reversals.

Indicator Features:
🔹Custom Colors
🔹Show/Hide Signals
🔹Alerts
Give this indicator a BOOST and COMMENT your thoughts!
We hope you enjoy.
Cheers!
Stochastic Oscillator
The indicator calculates three variations of the Fast Stochastic Oscillator for different time periods:
🔹Intermediate: Calculated over a medium-term period (default 31 bars).
🔹Momentum: Calculated over a short-term period (default 5 bars).
🔹Near Term: Calculated over a very short-term period (default 3 bars).
These calculations involve finding the highest and lowest values within their respective periods and comparing the current close to this range.
Moving Average Smoothing
The results of the Fast Stochastic Oscillator for the Intermediate and Near Term are then smoothed using a Simple Moving Average (SMA):
🔹Intermediate: 5-period SMA of the Intermediate Stochastic Oscillator.
🔹Near Term: 2-period SMA of the Near Term Stochastic Oscillator.
Momentum Indicator
A custom momentum calculation is performed, using the recent high and low prices over four periods.
Display
The indicator plots the smoothed Intermediate, Near Term, and custom Momentum calculations as separate lines on the chart.
Trading Signals
While the original indicator plots the lines mentioned above, the Market Forecast w/ Signals goes a step further by identifying key moments when nuanced signals fire. The built in alerts and visual aids make spotting these trading opportunities a breeze.
Clusters - Bullish and Bearish clusters are identified based on the convergence of all three lines (Intermediate, Near, and Momentum) above 80 (Bearish) or below 20 (Bullish).
The background color of the chart changes to indicate these clusters, aiding in quick identification of market extremes.
Trend Reversals - Marked with labels on the chart, this is based on the direction of the cluster (bullish or bearish) and the subsequent price movement crossing a threshold determined during the cluster formation.
Divergences - Divergences between the Near Term line and price highs/lows are detected using pivot points. These divergences are then plotted as lines on the chart, highlighting potential discrepancies between price action and momentum, which can signal reversals.
Indicator Features:
🔹Custom Colors
🔹Show/Hide Signals
🔹Alerts
Give this indicator a BOOST and COMMENT your thoughts!
We hope you enjoy.
Cheers!
오픈 소스 스크립트
트레이딩뷰의 진정한 정신에 따라, 이 스크립트의 작성자는 이를 오픈소스로 공개하여 트레이더들이 기능을 검토하고 검증할 수 있도록 했습니다. 작성자에게 찬사를 보냅니다! 이 코드는 무료로 사용할 수 있지만, 코드를 재게시하는 경우 하우스 룰이 적용된다는 점을 기억하세요.
Get Access to the exclusive QuantVue indicators: quantvue.io/
Join thousands of traders in our Free Discord: discord.gg/tC7u7magU3
Join thousands of traders in our Free Discord: discord.gg/tC7u7magU3
면책사항
해당 정보와 게시물은 금융, 투자, 트레이딩 또는 기타 유형의 조언이나 권장 사항으로 간주되지 않으며, 트레이딩뷰에서 제공하거나 보증하는 것이 아닙니다. 자세한 내용은 이용 약관을 참조하세요.