OPEN-SOURCE SCRIPT
업데이트됨 Plot Level on Threshold Exceed
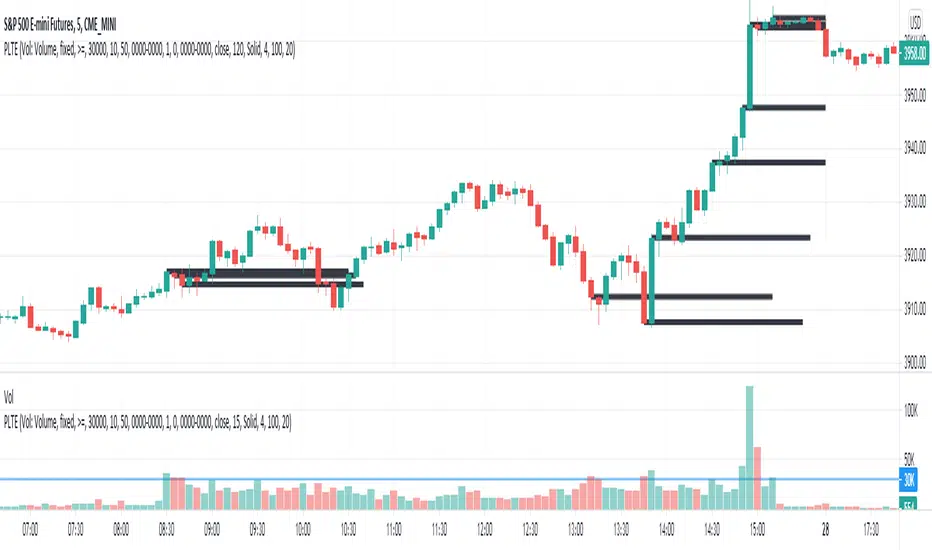
This script plots a line for X minutes, when the given reference source (which could be another indicator like volume, etc), exceeds the fixed value threshold.
There is a line limit in TV, so only the most recent 40 lines are plotted
There is a line limit in TV, so only the most recent 40 lines are plotted
릴리즈 노트
Added numerous other threshold types (sma, ema, wma, rma, swma, percentiles)Added custom comparator logic (<, <=, =, >, >=)
Added threshold multiplier
Added ability to plot threshold itself
릴리즈 노트
Added in sample session filter (only include samples during desired session times)Added in percentiles and stddev/ma thresholds
Added in efficiencies for line management
Added in plotshape functionality
릴리즈 노트
Threshold offset field added to prevent current bar influencing the threshold itself (if desired)릴리즈 노트
Updated with additional capabilities for plotarrow and plotchar릴리즈 노트
Updated for cross-based comparators릴리즈 노트
Updated arrow logic to be in line with threshold break direction, or alternatively select to reverse this logic.오픈 소스 스크립트
트레이딩뷰의 진정한 정신에 따라, 이 스크립트의 작성자는 이를 오픈소스로 공개하여 트레이더들이 기능을 검토하고 검증할 수 있도록 했습니다. 작성자에게 찬사를 보냅니다! 이 코드는 무료로 사용할 수 있지만, 코드를 재게시하는 경우 하우스 룰이 적용된다는 점을 기억하세요.
면책사항
해당 정보와 게시물은 금융, 투자, 트레이딩 또는 기타 유형의 조언이나 권장 사항으로 간주되지 않으며, 트레이딩뷰에서 제공하거나 보증하는 것이 아닙니다. 자세한 내용은 이용 약관을 참조하세요.
오픈 소스 스크립트
트레이딩뷰의 진정한 정신에 따라, 이 스크립트의 작성자는 이를 오픈소스로 공개하여 트레이더들이 기능을 검토하고 검증할 수 있도록 했습니다. 작성자에게 찬사를 보냅니다! 이 코드는 무료로 사용할 수 있지만, 코드를 재게시하는 경우 하우스 룰이 적용된다는 점을 기억하세요.
면책사항
해당 정보와 게시물은 금융, 투자, 트레이딩 또는 기타 유형의 조언이나 권장 사항으로 간주되지 않으며, 트레이딩뷰에서 제공하거나 보증하는 것이 아닙니다. 자세한 내용은 이용 약관을 참조하세요.