OPEN-SOURCE SCRIPT
Tick Chart RSI
Hello All,
This is Tick Chart RSI script and it calculates & shows RSI for Tick Chart. What is Tick chart? Tick Chart is created using ticks and each candlestick in Tick Chart shows the price variation of X consecutive ticks (X : Number of Ticks Per Candle). For example if you set "Number of Ticks Per Candle" = 100 then each candlestick is created using 100 ticks. so, Tick Charts are NOT time-based charts (like Renko or Point & Figure Charts). Tick is the price change in minimum time interval defined in the platform. There are several advantages of Tick Charts. You can find many articles about Tick Charts on the net.
Tick Chart and Tick Chart RSI only work on realtime bars.
You can set "Number of Ticks Per Candle" and the colors. You can also set any of the candles OHLC values as source for RSI.
While using Tick Chart RSI I recommend you to add Tick Chart as well.
P.S. Tick Chart RSI script can be developed using different methods. in this script, all RSI values are calculated on each tick because RSI is calculated for only real-time bars, and also calculated for limited number of bars
Tick Chart and Tick Chart RSI:

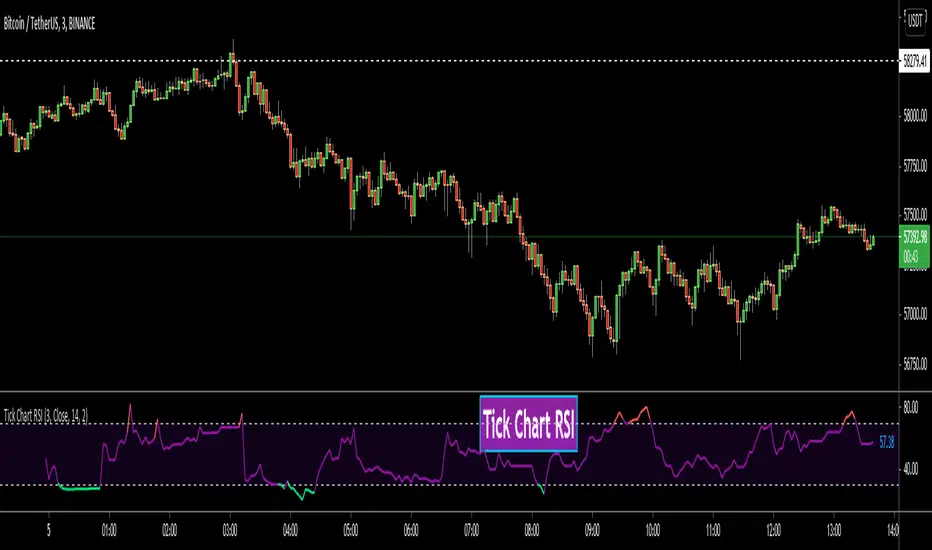
Tick Chart RSI:

Enjoy!
This is Tick Chart RSI script and it calculates & shows RSI for Tick Chart. What is Tick chart? Tick Chart is created using ticks and each candlestick in Tick Chart shows the price variation of X consecutive ticks (X : Number of Ticks Per Candle). For example if you set "Number of Ticks Per Candle" = 100 then each candlestick is created using 100 ticks. so, Tick Charts are NOT time-based charts (like Renko or Point & Figure Charts). Tick is the price change in minimum time interval defined in the platform. There are several advantages of Tick Charts. You can find many articles about Tick Charts on the net.
Tick Chart and Tick Chart RSI only work on realtime bars.
You can set "Number of Ticks Per Candle" and the colors. You can also set any of the candles OHLC values as source for RSI.
While using Tick Chart RSI I recommend you to add Tick Chart as well.
P.S. Tick Chart RSI script can be developed using different methods. in this script, all RSI values are calculated on each tick because RSI is calculated for only real-time bars, and also calculated for limited number of bars
Tick Chart and Tick Chart RSI:
Tick Chart RSI:
Enjoy!
오픈 소스 스크립트
트레이딩뷰의 진정한 정신에 따라, 이 스크립트의 작성자는 이를 오픈소스로 공개하여 트레이더들이 기능을 검토하고 검증할 수 있도록 했습니다. 작성자에게 찬사를 보냅니다! 이 코드는 무료로 사용할 수 있지만, 코드를 재게시하는 경우 하우스 룰이 적용된다는 점을 기억하세요.
🤝 LonesomeTheBlue community
t.me/LonesomeTheBlue_Official
🎦 YouTube Channel
Youtube.com/@lonesometheblue/videos
💰 Subscription to Pro indicators
Tradingview.com/spaces/LonesomeTheBlue/
t.me/LonesomeTheBlue_Official
🎦 YouTube Channel
Youtube.com/@lonesometheblue/videos
💰 Subscription to Pro indicators
Tradingview.com/spaces/LonesomeTheBlue/
면책사항
해당 정보와 게시물은 금융, 투자, 트레이딩 또는 기타 유형의 조언이나 권장 사항으로 간주되지 않으며, 트레이딩뷰에서 제공하거나 보증하는 것이 아닙니다. 자세한 내용은 이용 약관을 참조하세요.