OPEN-SOURCE SCRIPT
업데이트됨 Stationary Extrapolated Levels Oscillator
Introduction
The oscillator version of the stationary extrapolated levels indicator. The methodology behind the extrapolated levels where to minimize the risk of making a decision based only on a forecast, therefore the indicator plotted levels in order to determine possible reversal points, signals where generated when the detrended series crossed over/under those levels.
The Indicator
First we detrend the price, this is because forecasting the trend is often harder than a series without trend (stationarity > non-stationarity), then we forecast the detrended price with a linear extrapolation over a period of length and apply a max/min filter twice to the forecast, the max/min filters are just the highest and lowest function in pine. So the max/min filter have lag length/2, by applying it two times we have a lag of length which is the period of the forecast. Because we use highest and lowest we can apply min-max normalization in the form of :
x' = (x - min(x, min'))/(max(x,max') - min(x, min'))
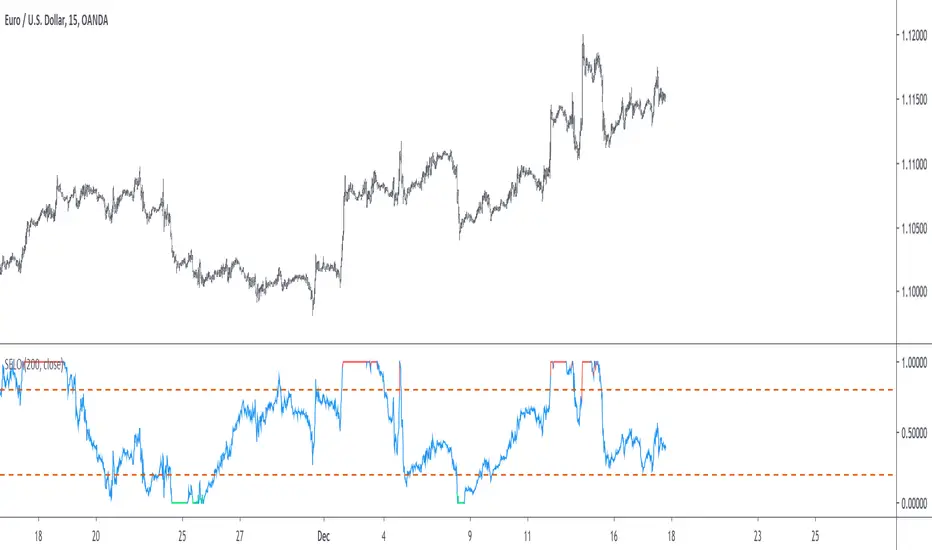
where x is the detrended price, max' the highest of the forecast of x and min' the lowest of the forecast of x. This result in a scaled oscillator in a range of (1,0),
When the indicator is equal to 1 or 0 there are high chances of reversals, more in depth this mean that the detrended price have crossed the highest/lowest of the forecast, when the indicator is equal to 0 or 1 for a long time this mean that the forecast was quite inaccurate, you can minimize risk by focusing on the cross between the detrended price and the 0.8/0.2 levels.
Conclusion
I've shown an oscillator version of my previous "Stationary extrapolated levels" indicator, the method involving taking the highest and lowest of the forecast is a great way to minimize the risk involved by time-series forecasting driven decisions. So i hope you find an use to it.
Thanks for reading !
The oscillator version of the stationary extrapolated levels indicator. The methodology behind the extrapolated levels where to minimize the risk of making a decision based only on a forecast, therefore the indicator plotted levels in order to determine possible reversal points, signals where generated when the detrended series crossed over/under those levels.
The Indicator
First we detrend the price, this is because forecasting the trend is often harder than a series without trend (stationarity > non-stationarity), then we forecast the detrended price with a linear extrapolation over a period of length and apply a max/min filter twice to the forecast, the max/min filters are just the highest and lowest function in pine. So the max/min filter have lag length/2, by applying it two times we have a lag of length which is the period of the forecast. Because we use highest and lowest we can apply min-max normalization in the form of :
x' = (x - min(x, min'))/(max(x,max') - min(x, min'))
where x is the detrended price, max' the highest of the forecast of x and min' the lowest of the forecast of x. This result in a scaled oscillator in a range of (1,0),
When the indicator is equal to 1 or 0 there are high chances of reversals, more in depth this mean that the detrended price have crossed the highest/lowest of the forecast, when the indicator is equal to 0 or 1 for a long time this mean that the forecast was quite inaccurate, you can minimize risk by focusing on the cross between the detrended price and the 0.8/0.2 levels.
Conclusion
I've shown an oscillator version of my previous "Stationary extrapolated levels" indicator, the method involving taking the highest and lowest of the forecast is a great way to minimize the risk involved by time-series forecasting driven decisions. So i hope you find an use to it.
Thanks for reading !
릴리즈 노트
- v4- additional changes
오픈 소스 스크립트
트레이딩뷰의 진정한 정신에 따라, 이 스크립트의 작성자는 이를 오픈소스로 공개하여 트레이더들이 기능을 검토하고 검증할 수 있도록 했습니다. 작성자에게 찬사를 보냅니다! 이 코드는 무료로 사용할 수 있지만, 코드를 재게시하는 경우 하우스 룰이 적용된다는 점을 기억하세요.
Check out the indicators we are making at luxalgo: tradingview.com/u/LuxAlgo/
"My heart is so loud that I can't hear the fireworks"
"My heart is so loud that I can't hear the fireworks"
면책사항
해당 정보와 게시물은 금융, 투자, 트레이딩 또는 기타 유형의 조언이나 권장 사항으로 간주되지 않으며, 트레이딩뷰에서 제공하거나 보증하는 것이 아닙니다. 자세한 내용은 이용 약관을 참조하세요.