PROTECTED SOURCE SCRIPT
First X Hours – Daily & Weekly (Auto-DST, Midlines & Labels)
Description
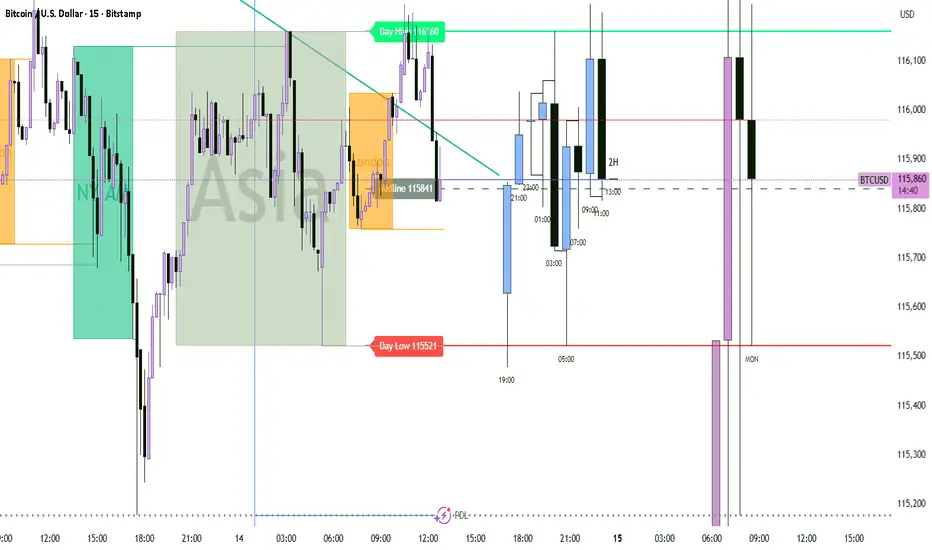
This indicator automatically plots the High, Low, and optional Midline of the first X trading hours for both the Daily and Weekly sessions. It is designed for traders who want to quickly identify early-session ranges and key levels that often act as intraday or intraweek support/resistance zones.
✅ Features:
Works for both Daily and Weekly sessions (enable/disable individually).
Fully configurable: choose how many hours to include (e.g., 8 hours).
Adjustable start time (hour) and automatic DST handling using named timezones (e.g., Europe/London, New York, Sydney).
Customizable line colours, thickness, and styles.
Optional midline (average of high & low) for range balance levels.
Optional labels with price tags for clear visibility.
Lines can be extended to the right for forward-projection.
🔎 Use cases:
Identify early-session ranges that may define the trading day or week.
Track breakouts above/below first-X-hours ranges.
Highlight key liquidity levels where price often reacts.
Combine with your strategy for confirmation of reversals or continuations.
⚠️ Note:
Indicator does not provide trading signals.
Best used on intraday timeframes (e.g., 5m–1h) for daily ranges, and H1–H4 for weekly ranges.
보호된 스크립트입니다
이 스크립트는 비공개 소스로 게시됩니다. 하지만 제한 없이 자유롭게 사용할 수 있습니다 — 여기에서 자세히 알아보기.
면책사항
이 정보와 게시물은 TradingView에서 제공하거나 보증하는 금융, 투자, 거래 또는 기타 유형의 조언이나 권고 사항을 의미하거나 구성하지 않습니다. 자세한 내용은 이용 약관을 참고하세요.
면책사항
이 정보와 게시물은 TradingView에서 제공하거나 보증하는 금융, 투자, 거래 또는 기타 유형의 조언이나 권고 사항을 의미하거나 구성하지 않습니다. 자세한 내용은 이용 약관을 참고하세요.