INVITE-ONLY SCRIPT
업데이트됨 Zeta Breakout
If I ask you what moves the price, most of you will say the same old answer: Demand & Supply
But who creates Demand & Supply? You or Me, the retailers? No. It is Big Institutions and Mutual Funds and Big Banks which create this demand and supply because the
share of retailers in Stock Market is so little it does not affect the price in a big way.
The Big Institutions, Mutual Funds, Big Banks or in some cases Governments, are collectively called Smart Money.
When Smart Money steps in, the previous levels of Support or Resistance are broken and then the up or down move starts which most probably goes a certain distance.
Now the Support or Resistance levels are not static, they are dynamic in nature and keep changing with the time.
How does this indicator work?
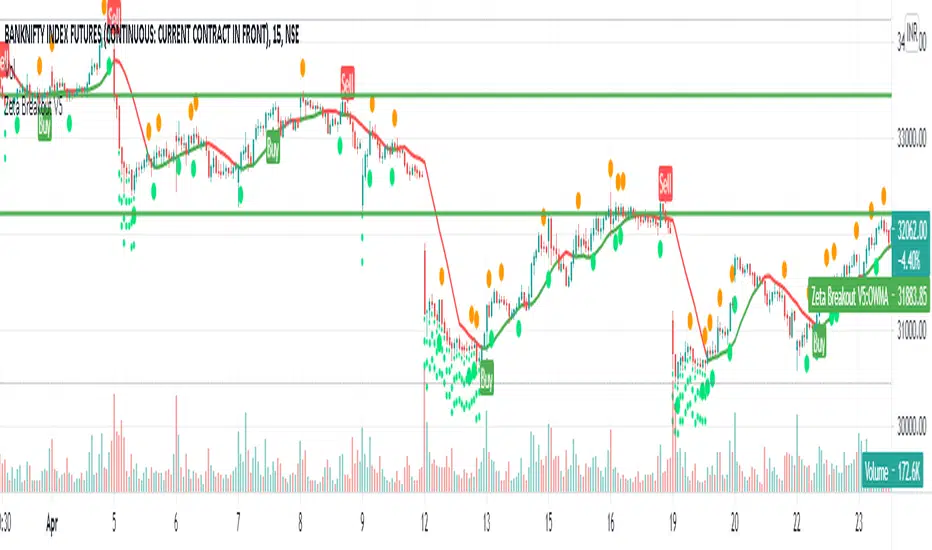
Zeta Breakout dynamically and automatically detects and marks these levels and when the price break-outs or break-downs or bounces up or down from these levels, the Buy or Sell Signals are generated for you to follow.
The indicator keeps watching previous or newly created levels of Support or Resistance and as soon as price crosses these levels or bounces from these levels, the user is alerted in the form of 'Buy' or 'Sell' Signals.
How to use this indicator?
1. When you see a Buy Signal, take Buy Position and hold it till either (a) You see opposite signal or (b) Your Stop Loss is hit which is ideally the low of candle preceding the signal candle or any other user defined SL. If your stop loss is hit and then price again starts moving in the same direction as indicated by the last Buy signal, take a fresh position as soon as the price crosses the level where previous signal is sitting.
2. When you see a Sell Signal, close your Buy Position, take a Sell position and hold it till either (a) You see opposite signal or (b) Your Stop Loss is hit which is ideally the high of candle preceding the signal candle or any user defined SL. If your stop loss is hit and then price again starts moving in the same direction as indicated by the last Sell signal, take a fresh position as soon as the price crosses the level where previous signal is sitting.
What are the target instruments/markets for this indicator?
This indicator can be used on Stocks, Indices, Gold , Silver , Currency Pairs, Crude Oil or anything being trades on any exchange in the world.
This indicator is not limited to any specific time-frame. You may select any time-frame which suits your trading style.
How can you get this indicator?
This is an invite-only paid indicator but we can give you FREE TRIAL for 05 days if you are interested.
For Free Trial, send a message to jellygill
But who creates Demand & Supply? You or Me, the retailers? No. It is Big Institutions and Mutual Funds and Big Banks which create this demand and supply because the
share of retailers in Stock Market is so little it does not affect the price in a big way.
The Big Institutions, Mutual Funds, Big Banks or in some cases Governments, are collectively called Smart Money.
When Smart Money steps in, the previous levels of Support or Resistance are broken and then the up or down move starts which most probably goes a certain distance.
Now the Support or Resistance levels are not static, they are dynamic in nature and keep changing with the time.
How does this indicator work?
Zeta Breakout dynamically and automatically detects and marks these levels and when the price break-outs or break-downs or bounces up or down from these levels, the Buy or Sell Signals are generated for you to follow.
The indicator keeps watching previous or newly created levels of Support or Resistance and as soon as price crosses these levels or bounces from these levels, the user is alerted in the form of 'Buy' or 'Sell' Signals.
How to use this indicator?
1. When you see a Buy Signal, take Buy Position and hold it till either (a) You see opposite signal or (b) Your Stop Loss is hit which is ideally the low of candle preceding the signal candle or any other user defined SL. If your stop loss is hit and then price again starts moving in the same direction as indicated by the last Buy signal, take a fresh position as soon as the price crosses the level where previous signal is sitting.
2. When you see a Sell Signal, close your Buy Position, take a Sell position and hold it till either (a) You see opposite signal or (b) Your Stop Loss is hit which is ideally the high of candle preceding the signal candle or any user defined SL. If your stop loss is hit and then price again starts moving in the same direction as indicated by the last Sell signal, take a fresh position as soon as the price crosses the level where previous signal is sitting.
What are the target instruments/markets for this indicator?
This indicator can be used on Stocks, Indices, Gold , Silver , Currency Pairs, Crude Oil or anything being trades on any exchange in the world.
This indicator is not limited to any specific time-frame. You may select any time-frame which suits your trading style.
How can you get this indicator?
This is an invite-only paid indicator but we can give you FREE TRIAL for 05 days if you are interested.
For Free Trial, send a message to jellygill
릴리즈 노트
Minor Tweakings done to nullify false breakouts.릴리즈 노트
Updated the code to remove some minor glitches which caused delayed detection in some cases.릴리즈 노트
Changed Settings which delayed Alert Trigger.릴리즈 노트
Updated settings to get little earlier signals.릴리즈 노트
Vastly improved code which is faster, more efficient and gives less number of signals.릴리즈 노트
Much Improved code which gives more trades by detecting faster Direction Changes.릴리즈 노트
Updated Version Number초대 전용 스크립트
이 스크립트는 작성자가 승인한 사용자만 접근할 수 있습니다. 사용하려면 요청 후 승인을 받아야 하며, 일반적으로 결제 후에 허가가 부여됩니다. 자세한 내용은 아래 작성자의 안내를 따르거나 jellygill에게 직접 문의하세요.
트레이딩뷰는 스크립트의 작동 방식을 충분히 이해하고 작성자를 완전히 신뢰하지 않는 이상, 해당 스크립트에 비용을 지불하거나 사용하는 것을 권장하지 않습니다. 커뮤니티 스크립트에서 무료 오픈소스 대안을 찾아보실 수도 있습니다.
작성자 지시 사항
As a benchmark, we tested the code on Bank Nifty. The tested time-frames are 5 min. 10 min. 15 min. 30 min. 01 hour. 02 hour and daily candle.
It works well in all these time frames
To avail FREE TRIAL for all our invite-only indicators, please contact us:
Telegram: @jellygill
Our Telegram Channel: @CheetaTrader
join to complete FREE TRAINING on how to use the indicators effectively and then request @jellygill for FREE TRIAL
Telegram: @jellygill
Our Telegram Channel: @CheetaTrader
join to complete FREE TRAINING on how to use the indicators effectively and then request @jellygill for FREE TRIAL
면책사항
해당 정보와 게시물은 금융, 투자, 트레이딩 또는 기타 유형의 조언이나 권장 사항으로 간주되지 않으며, 트레이딩뷰에서 제공하거나 보증하는 것이 아닙니다. 자세한 내용은 이용 약관을 참조하세요.
초대 전용 스크립트
이 스크립트는 작성자가 승인한 사용자만 접근할 수 있습니다. 사용하려면 요청 후 승인을 받아야 하며, 일반적으로 결제 후에 허가가 부여됩니다. 자세한 내용은 아래 작성자의 안내를 따르거나 jellygill에게 직접 문의하세요.
트레이딩뷰는 스크립트의 작동 방식을 충분히 이해하고 작성자를 완전히 신뢰하지 않는 이상, 해당 스크립트에 비용을 지불하거나 사용하는 것을 권장하지 않습니다. 커뮤니티 스크립트에서 무료 오픈소스 대안을 찾아보실 수도 있습니다.
작성자 지시 사항
As a benchmark, we tested the code on Bank Nifty. The tested time-frames are 5 min. 10 min. 15 min. 30 min. 01 hour. 02 hour and daily candle.
It works well in all these time frames
To avail FREE TRIAL for all our invite-only indicators, please contact us:
Telegram: @jellygill
Our Telegram Channel: @CheetaTrader
join to complete FREE TRAINING on how to use the indicators effectively and then request @jellygill for FREE TRIAL
Telegram: @jellygill
Our Telegram Channel: @CheetaTrader
join to complete FREE TRAINING on how to use the indicators effectively and then request @jellygill for FREE TRIAL
면책사항
해당 정보와 게시물은 금융, 투자, 트레이딩 또는 기타 유형의 조언이나 권장 사항으로 간주되지 않으며, 트레이딩뷰에서 제공하거나 보증하는 것이 아닙니다. 자세한 내용은 이용 약관을 참조하세요.