OPEN-SOURCE SCRIPT
Triple RSI | MisinkoMaster
The Triple RSI (TRSI) is an advanced trend-following oscillator designed to capture trend reversals with speed and smoothness, combining concepts from traditional RSI, multi-timeframe momentum analysis, and layered moving average smoothing.
By blending multiple RSI lengths and applying a unique smoothing sequence, the TRSI creates a fast, momentum-driven RSI oscillator that reduces noise without sacrificing responsiveness.
🔎 Methodology
The indicator is built in three main steps:
Multi-Length RSI Calculation
Three RSIs are calculated using different lengths derived from the user’s input n:
RSI(√n) → very fast, highly responsive.
RSI(n/2) → moderately fast.
RSI(n) → slower, more stable baseline.
Each RSI is normalized by subtracting 50, centering values around zero.
Triple RSI Formula
The three RSIs are combined into the base formula:
TRSI=RSI(√n)+RSI(n/2)−RSI(n)
TRSI=RSI(√n)+RSI(n/2)−RSI(n)
This subtracts the slower RSI from the faster ones, boosting responsiveness and making the TRSI more momentum-oriented than a standard RSI.
Layered Smoothing
The raw TRSI is smoothed in three steps:
RMA(n/2)
RMA(√n)
HMA(√n)
This sequence balances stability and speed:
RMA provides consistency and reduces false noise.
HMA adds responsiveness and precision.
The result is a smooth yet reactive oscillator, optimized for reversal detection.
📈 Trend Classification
The TRSI offers three ways to interpret trend direction:
Oscillator Values
Above 0 → Bullish (uptrend).
Below 0 → Bearish (downtrend).
Oscillator Colors
Green TRSI line → Positive momentum.
Red TRSI line → Negative momentum.
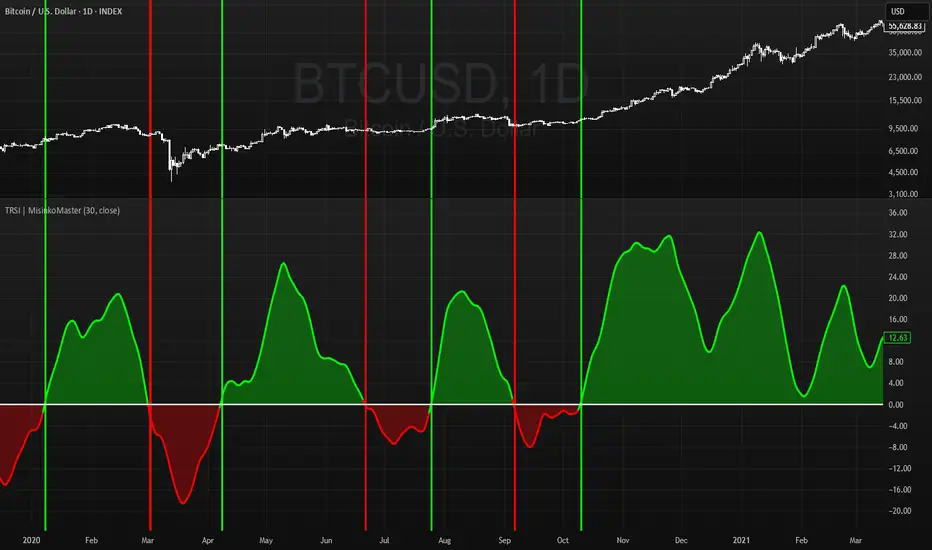
Background Colors
Green background flash → Reversal into bullish trend.
Red background flash → Reversal into bearish trend.
This makes it easy to scan past price history and quickly identify turning points.
🎨 Visualization
TRSI line plotted with dynamic coloring (green/red).
Filled area between TRSI and zero-line reflects momentum bias.
Background flashes highlight trend reversal points, adding context and clarity for visual traders.
⚡ Features
Adjustable length parameter (n).
Dynamic use of √n and n/2 for multi-speed RSI blending.
Built-in smoothing with 2× RMA + 1× HMA.
Multiple trend detection methods (value, color, background).
Works across all assets and timeframes (crypto, forex, stocks, indices).
✅ Use Cases
Reversal Detection → Catch early shifts in trend direction.
Trend Confirmation → Stay aligned with momentum.
Momentum Filter → Avoid counter-trend trades in trending markets.
Historical Analysis → Quickly scan past reversals via background coloring.
⚠️ Limitations
As with all oscillators, TRSI may give false signals in sideways/choppy markets.
Optimal sensitivity depends on asset volatility → adjust n for best results.
It is not a standalone system and should be combined with other tools (trend filters, volume, higher timeframe confluence).
By blending multiple RSI lengths and applying a unique smoothing sequence, the TRSI creates a fast, momentum-driven RSI oscillator that reduces noise without sacrificing responsiveness.
🔎 Methodology
The indicator is built in three main steps:
Multi-Length RSI Calculation
Three RSIs are calculated using different lengths derived from the user’s input n:
RSI(√n) → very fast, highly responsive.
RSI(n/2) → moderately fast.
RSI(n) → slower, more stable baseline.
Each RSI is normalized by subtracting 50, centering values around zero.
Triple RSI Formula
The three RSIs are combined into the base formula:
TRSI=RSI(√n)+RSI(n/2)−RSI(n)
TRSI=RSI(√n)+RSI(n/2)−RSI(n)
This subtracts the slower RSI from the faster ones, boosting responsiveness and making the TRSI more momentum-oriented than a standard RSI.
Layered Smoothing
The raw TRSI is smoothed in three steps:
RMA(n/2)
RMA(√n)
HMA(√n)
This sequence balances stability and speed:
RMA provides consistency and reduces false noise.
HMA adds responsiveness and precision.
The result is a smooth yet reactive oscillator, optimized for reversal detection.
📈 Trend Classification
The TRSI offers three ways to interpret trend direction:
Oscillator Values
Above 0 → Bullish (uptrend).
Below 0 → Bearish (downtrend).
Oscillator Colors
Green TRSI line → Positive momentum.
Red TRSI line → Negative momentum.
Background Colors
Green background flash → Reversal into bullish trend.
Red background flash → Reversal into bearish trend.
This makes it easy to scan past price history and quickly identify turning points.
🎨 Visualization
TRSI line plotted with dynamic coloring (green/red).
Filled area between TRSI and zero-line reflects momentum bias.
Background flashes highlight trend reversal points, adding context and clarity for visual traders.
⚡ Features
Adjustable length parameter (n).
Dynamic use of √n and n/2 for multi-speed RSI blending.
Built-in smoothing with 2× RMA + 1× HMA.
Multiple trend detection methods (value, color, background).
Works across all assets and timeframes (crypto, forex, stocks, indices).
✅ Use Cases
Reversal Detection → Catch early shifts in trend direction.
Trend Confirmation → Stay aligned with momentum.
Momentum Filter → Avoid counter-trend trades in trending markets.
Historical Analysis → Quickly scan past reversals via background coloring.
⚠️ Limitations
As with all oscillators, TRSI may give false signals in sideways/choppy markets.
Optimal sensitivity depends on asset volatility → adjust n for best results.
It is not a standalone system and should be combined with other tools (trend filters, volume, higher timeframe confluence).
오픈 소스 스크립트
트레이딩뷰의 진정한 정신에 따라, 이 스크립트의 작성자는 이를 오픈소스로 공개하여 트레이더들이 기능을 검토하고 검증할 수 있도록 했습니다. 작성자에게 찬사를 보냅니다! 이 코드는 무료로 사용할 수 있지만, 코드를 재게시하는 경우 하우스 룰이 적용된다는 점을 기억하세요.
"Better to take a step back, than to stand stuck forever."
면책사항
해당 정보와 게시물은 금융, 투자, 트레이딩 또는 기타 유형의 조언이나 권장 사항으로 간주되지 않으며, 트레이딩뷰에서 제공하거나 보증하는 것이 아닙니다. 자세한 내용은 이용 약관을 참조하세요.