INVITE-ONLY SCRIPT
CM EMA Crossover Price Probabilities custom
CM EMA Crossover Price Probabilities
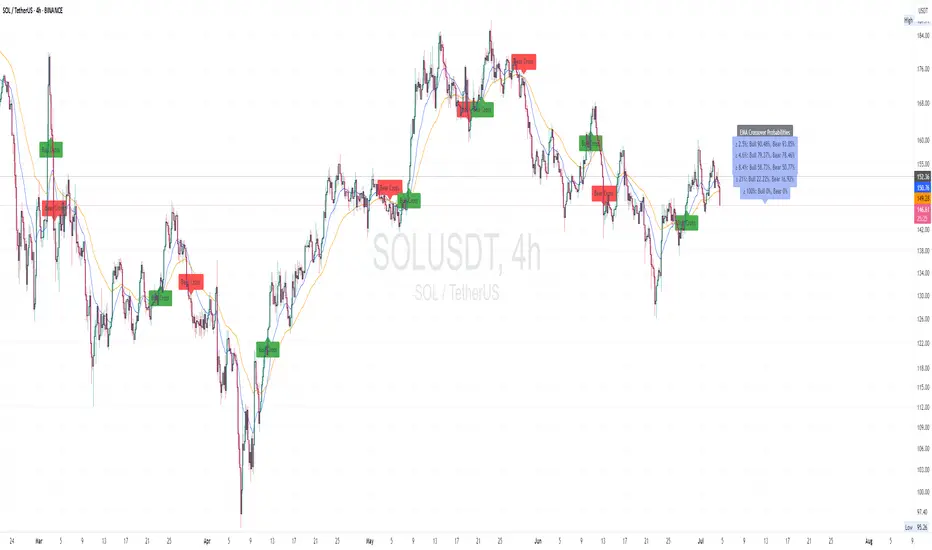
This indicator combines Exponential Moving Average (EMA) crossovers with swing high/low detection to calculate and display the historical probability of price movements exceeding user-defined percentage thresholds. Unlike standard EMA crossover indicators, it quantifies the likelihood of specific price changes following bullish (fast EMA crossing above slow EMA) or bearish (fast EMA crossing below slow EMA) crossovers, providing traders with data-driven insights into potential price behavior.
How It Works:EMA Crossovers: Detects when the fast EMA crosses above (bullish) or below (bearish) the slow EMA, marking these events with chart labels.
Price Change Measurement: Measures the percentage price change from the crossover point to the next swing high (for bullish crossovers) or swing low (for bearish crossovers), using pivot point detection.
Probability Calculation: Analyses historical crossover data to compute the probability of price changes meeting or exceeding customizable percentage thresholds (e.g., 2.5%, 5%). Probabilities are displayed as labels on the last bar, showing both bullish and bearish outcomes.
Customization: Allows users to adjust EMA lengths, pivot lookback, historical data limit, and probability thresholds via inputs.
Inputs:Fast EMA Length (default: 20): Period for the fast EMA.
Slow EMA Length (default: 50): Period for the slow EMA.
Pivot Lookback (default: 15): Bars used to detect swing highs/lows.
Max Historical Crossovers (default: 100): Limits stored crossovers for performance.
Bin Thresholds (defaults: 2.5%, 4.6%, 8.4%, 21.0%, 100.0%): Five customizable percentage thresholds for probability calculations.
Usage:
Add the indicator to your chart and adjust inputs to match your trading style. Bullish and bearish crossover points are labeled on the chart, and probability labels appear in the top-right corner when sufficient data is available. Use these probabilities to assess the historical likelihood of price movements after EMA crossovers, aiding in trade planning or risk assessment.
Why It’s Useful:
By combining EMA crossovers with swing-based price change analysis, this indicator offers a unique perspective on market behaviour post-crossover. The customizable probability thresholds allow traders to focus on specific price movement targets, making it a versatile tool for studying trend strength and potential outcomes.
Notes:
Probabilities are based on historical data and do not predict future performance.
Set bin thresholds in ascending order for accurate probability calculations.
Designed for educational purposes to analyze EMA crossover patterns.
초대 전용 스크립트
이 스크립트는 작성자가 승인한 사용자만 접근할 수 있습니다. 사용하려면 요청 후 승인을 받아야 하며, 일반적으로 결제 후에 허가가 부여됩니다. 자세한 내용은 아래 작성자의 안내를 따르거나 CryptoMainly에게 직접 문의하세요.
트레이딩뷰는 스크립트의 작동 방식을 충분히 이해하고 작성자를 완전히 신뢰하지 않는 이상, 해당 스크립트에 비용을 지불하거나 사용하는 것을 권장하지 않습니다. 커뮤니티 스크립트에서 무료 오픈소스 대안을 찾아보실 수도 있습니다.
작성자 지시 사항
Please contact me by Direct Message for further information.
Thank you for your interest!!
면책사항
해당 정보와 게시물은 금융, 투자, 트레이딩 또는 기타 유형의 조언이나 권장 사항으로 간주되지 않으며, 트레이딩뷰에서 제공하거나 보증하는 것이 아닙니다. 자세한 내용은 이용 약관을 참조하세요.