OPEN-SOURCE SCRIPT
업데이트됨 BTC Indicator By Megalodon Trading
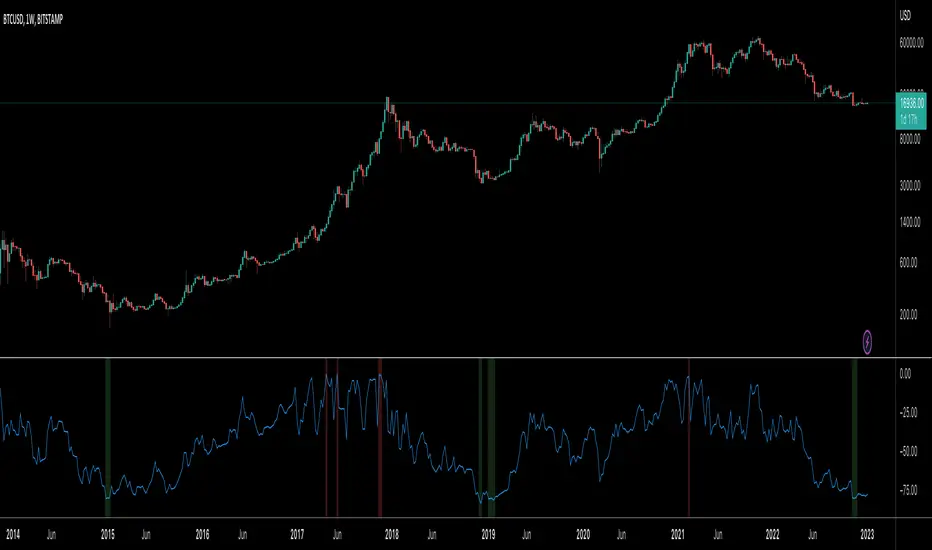
This indicator is designed help you see the potential reversal zones and it helps you accumulate for the long run.
This combines price data on any chart. The chart isolates between 0 and -100. Below -80 is a buy, above -20 is a sell location.
In these locations, try to Slowly Buy and Slowly Sell (accumulate...)
Story Of This Indicator
~I was always obsessed with Fibonacci and used Fibonacci all the time. Thus, i wanted to make a tool to see buying locations and selling locations.
Instead of drawing fibonacci's and manually interpreting buy/sell locations, i wanted algorithms to do the job for me. So, i created this algorithm and many more like it.
If you think i did a good job and want to do further work with me, feel free to contact.
I have a ton of other tools that can change everything for your trading/investing.
Best wishes
~Megalodon
릴리즈 노트
Added new settings for buy and sell levels. 오픈 소스 스크립트
트레이딩뷰의 진정한 정신에 따라, 이 스크립트의 작성자는 이를 오픈소스로 공개하여 트레이더들이 기능을 검토하고 검증할 수 있도록 했습니다. 작성자에게 찬사를 보냅니다! 이 코드는 무료로 사용할 수 있지만, 코드를 재게시하는 경우 하우스 룰이 적용된다는 점을 기억하세요.
Telegram Here t.me/bugrasukas
면책사항
해당 정보와 게시물은 금융, 투자, 트레이딩 또는 기타 유형의 조언이나 권장 사항으로 간주되지 않으며, 트레이딩뷰에서 제공하거나 보증하는 것이 아닙니다. 자세한 내용은 이용 약관을 참조하세요.
오픈 소스 스크립트
트레이딩뷰의 진정한 정신에 따라, 이 스크립트의 작성자는 이를 오픈소스로 공개하여 트레이더들이 기능을 검토하고 검증할 수 있도록 했습니다. 작성자에게 찬사를 보냅니다! 이 코드는 무료로 사용할 수 있지만, 코드를 재게시하는 경우 하우스 룰이 적용된다는 점을 기억하세요.
Telegram Here t.me/bugrasukas
면책사항
해당 정보와 게시물은 금융, 투자, 트레이딩 또는 기타 유형의 조언이나 권장 사항으로 간주되지 않으며, 트레이딩뷰에서 제공하거나 보증하는 것이 아닙니다. 자세한 내용은 이용 약관을 참조하세요.