OPEN-SOURCE SCRIPT
Order Block Detection By Zia (StockWiz)
What is an Order Block?
An order block is a concept used in technical analysis, particularly in price action trading and supply and demand analysis. It refers to a significant area on a price chart where institutional traders, such as banks and hedge funds, have placed large orders. These blocks of orders often create strong support or resistance levels, as they represent areas where the "smart money" has shown interest in buying or selling an asset.
Characteristics of Order Blocks:
1. High Volume: Order blocks are typically associated with high trading volume, indicating strong participation from large players in the market.
2. Price Rejection: They often lead to sharp reversals or consolidations in price, as the large orders absorb the market's liquidity and push the price in the opposite direction.
3. Formation: Order blocks are usually formed after significant price movements, such as strong bullish or bearish trends, and can be identified by clusters of candles with long wicks or significant body sizes.
4. Support and Resistance: Once identified, order blocks can serve as potential support or resistance levels in future price movements. Prices often return to these areas, where new orders can be executed.
Identifying Order Blocks:
To identify order blocks, traders look for specific patterns and price actions on the chart. Here is a step-by-step guide to finding order blocks:
1. Identify a Strong Move: Look for strong bullish or bearish moves, which are often the result of large institutional orders.
2. Find Consolidation : After the strong move, find areas where the price consolidates. This is where large orders were likely placed.
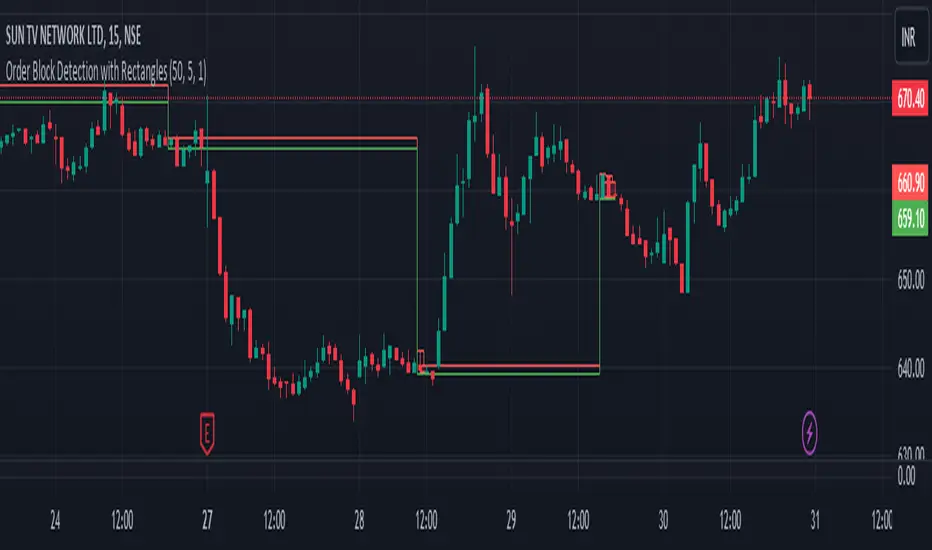
3. Look for Rejections: Identify areas where the price has been rejected multiple times, creating a clear support or resistance zone.
4. Mark the Order Block: Draw a rectangle around the consolidation area to mark the order block on your chart.
Student of Parag Mehta (StockWiz)
With Regards
Zia Rahim
An order block is a concept used in technical analysis, particularly in price action trading and supply and demand analysis. It refers to a significant area on a price chart where institutional traders, such as banks and hedge funds, have placed large orders. These blocks of orders often create strong support or resistance levels, as they represent areas where the "smart money" has shown interest in buying or selling an asset.
Characteristics of Order Blocks:
1. High Volume: Order blocks are typically associated with high trading volume, indicating strong participation from large players in the market.
2. Price Rejection: They often lead to sharp reversals or consolidations in price, as the large orders absorb the market's liquidity and push the price in the opposite direction.
3. Formation: Order blocks are usually formed after significant price movements, such as strong bullish or bearish trends, and can be identified by clusters of candles with long wicks or significant body sizes.
4. Support and Resistance: Once identified, order blocks can serve as potential support or resistance levels in future price movements. Prices often return to these areas, where new orders can be executed.
Identifying Order Blocks:
To identify order blocks, traders look for specific patterns and price actions on the chart. Here is a step-by-step guide to finding order blocks:
1. Identify a Strong Move: Look for strong bullish or bearish moves, which are often the result of large institutional orders.
2. Find Consolidation : After the strong move, find areas where the price consolidates. This is where large orders were likely placed.
3. Look for Rejections: Identify areas where the price has been rejected multiple times, creating a clear support or resistance zone.
4. Mark the Order Block: Draw a rectangle around the consolidation area to mark the order block on your chart.
Student of Parag Mehta (StockWiz)
With Regards
Zia Rahim
오픈 소스 스크립트
트레이딩뷰의 진정한 정신에 따라, 이 스크립트의 작성자는 이를 오픈소스로 공개하여 트레이더들이 기능을 검토하고 검증할 수 있도록 했습니다. 작성자에게 찬사를 보냅니다! 이 코드는 무료로 사용할 수 있지만, 코드를 재게시하는 경우 하우스 룰이 적용된다는 점을 기억하세요.
면책사항
해당 정보와 게시물은 금융, 투자, 트레이딩 또는 기타 유형의 조언이나 권장 사항으로 간주되지 않으며, 트레이딩뷰에서 제공하거나 보증하는 것이 아닙니다. 자세한 내용은 이용 약관을 참조하세요.
오픈 소스 스크립트
트레이딩뷰의 진정한 정신에 따라, 이 스크립트의 작성자는 이를 오픈소스로 공개하여 트레이더들이 기능을 검토하고 검증할 수 있도록 했습니다. 작성자에게 찬사를 보냅니다! 이 코드는 무료로 사용할 수 있지만, 코드를 재게시하는 경우 하우스 룰이 적용된다는 점을 기억하세요.
면책사항
해당 정보와 게시물은 금융, 투자, 트레이딩 또는 기타 유형의 조언이나 권장 사항으로 간주되지 않으며, 트레이딩뷰에서 제공하거나 보증하는 것이 아닙니다. 자세한 내용은 이용 약관을 참조하세요.