OPEN-SOURCE SCRIPT
Market Regime (w/ Adaptive Thresholds)
Logic Behind This Indicator
This indicator identifies market regimes (trending vs. mean-reverting) using adaptive thresholds that adjust to recent market conditions.
Core Components
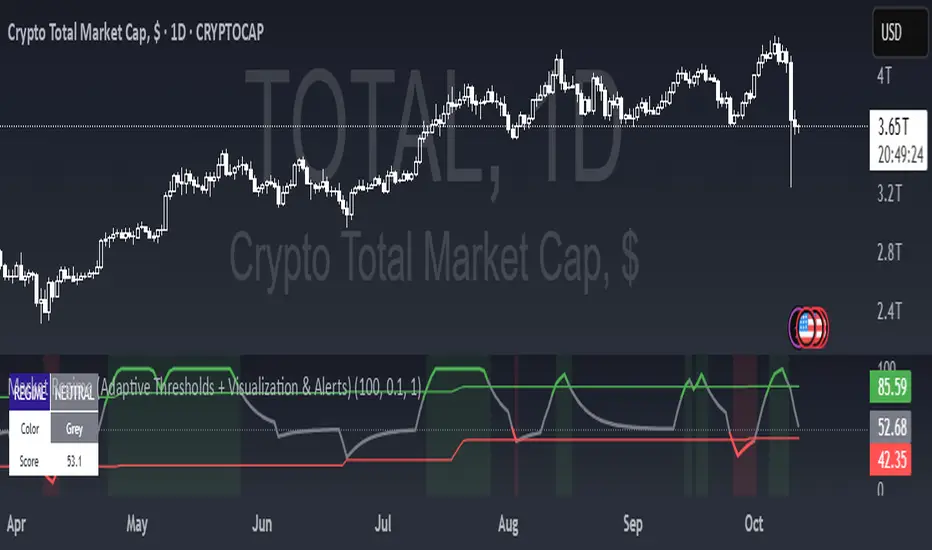
1. Regime Score Calculation (0-100 scale)
Starts at 50 (neutral) and adjusts based on two factors:
A. Trend Strength
Compares fast EMA (5) vs. slow EMA (10)
If fast > slow by >1% → +60 points (strong uptrend)
If fast < slow by >1% → -60 points (strong downtrend)
B. RSI Momentum
Uses 7-period RSI smoothed with 3-period EMA
RSI > 70 → +20 points (overbought/trending)
RSI < 30 → -20 points (oversold/mean-reverting)
The score is then smoothed and clamped between 0-100.
2. Adaptive Thresholds
Instead of fixed levels, thresholds adjust to recent market behavior:
Looks back 100 bars to find the min/max regime score
High threshold = 80% of the range (trending regime)
Low threshold = 20% of the range (mean-reverting regime)
This prevents false signals in different volatility environments.
3. Regime Classification
Regime Score Classification Meaning
Above high threshold STRONG TREND Market is trending strongly (follow momentum)
Below low threshold STRONG MEAN REVERSION Market is choppy/oversold (fade moves)
Between thresholds NEUTRAL No clear regime (stay out or wait)
4. Regime Persistence Filter
Requires the regime to hold for a minimum number of bars (default: 1) before confirming
Prevents whipsaws from brief score fluctuations
What It Aims to Detect
Visual Cues
This indicator identifies market regimes (trending vs. mean-reverting) using adaptive thresholds that adjust to recent market conditions.
Core Components
1. Regime Score Calculation (0-100 scale)
Starts at 50 (neutral) and adjusts based on two factors:
A. Trend Strength
Compares fast EMA (5) vs. slow EMA (10)
If fast > slow by >1% → +60 points (strong uptrend)
If fast < slow by >1% → -60 points (strong downtrend)
B. RSI Momentum
Uses 7-period RSI smoothed with 3-period EMA
RSI > 70 → +20 points (overbought/trending)
RSI < 30 → -20 points (oversold/mean-reverting)
The score is then smoothed and clamped between 0-100.
2. Adaptive Thresholds
Instead of fixed levels, thresholds adjust to recent market behavior:
Looks back 100 bars to find the min/max regime score
High threshold = 80% of the range (trending regime)
Low threshold = 20% of the range (mean-reverting regime)
This prevents false signals in different volatility environments.
3. Regime Classification
Regime Score Classification Meaning
Above high threshold STRONG TREND Market is trending strongly (follow momentum)
Below low threshold STRONG MEAN REVERSION Market is choppy/oversold (fade moves)
Between thresholds NEUTRAL No clear regime (stay out or wait)
4. Regime Persistence Filter
Requires the regime to hold for a minimum number of bars (default: 1) before confirming
Prevents whipsaws from brief score fluctuations
What It Aims to Detect
- When to use trend-following strategies (green = buy breakouts, ride momentum)
- When to use mean-reversion strategies (red = buy dips, sell rallies)
- When to stay out (gray = unclear conditions, high risk of false signals)
Visual Cues
- Green background = Strong trend (momentum strategies work)
- Red background = Strong mean reversion (contrarian strategies work)
- Table = Shows current regime, color, and score
- Alerts = Notifies when regime changes
오픈 소스 스크립트
트레이딩뷰의 진정한 정신에 따라, 이 스크립트의 작성자는 이를 오픈소스로 공개하여 트레이더들이 기능을 검토하고 검증할 수 있도록 했습니다. 작성자에게 찬사를 보냅니다! 이 코드는 무료로 사용할 수 있지만, 코드를 재게시하는 경우 하우스 룰이 적용된다는 점을 기억하세요.
면책사항
해당 정보와 게시물은 금융, 투자, 트레이딩 또는 기타 유형의 조언이나 권장 사항으로 간주되지 않으며, 트레이딩뷰에서 제공하거나 보증하는 것이 아닙니다. 자세한 내용은 이용 약관을 참조하세요.
오픈 소스 스크립트
트레이딩뷰의 진정한 정신에 따라, 이 스크립트의 작성자는 이를 오픈소스로 공개하여 트레이더들이 기능을 검토하고 검증할 수 있도록 했습니다. 작성자에게 찬사를 보냅니다! 이 코드는 무료로 사용할 수 있지만, 코드를 재게시하는 경우 하우스 룰이 적용된다는 점을 기억하세요.
면책사항
해당 정보와 게시물은 금융, 투자, 트레이딩 또는 기타 유형의 조언이나 권장 사항으로 간주되지 않으며, 트레이딩뷰에서 제공하거나 보증하는 것이 아닙니다. 자세한 내용은 이용 약관을 참조하세요.