PROTECTED SOURCE SCRIPT
업데이트됨 [blackcat] L3 Trendline LTF
Level: 3
Background
Trendlines are easily recognizable lines that traders draw on charts to connect a series of prices together or show some data's best fit. The resulting line is then used to give the trader a good idea of the direction in which an investment's value might move. A trendline is a line drawn over pivot highs or under pivot lows to show the prevailing direction of price. Trendlines are a visual representation of support and resistance in any time frame. They show direction and speed of price, and also describe patterns during periods of price contraction.
Function
This is a noval low time frame (LTF) trendline which was inquired from TradingView community. "How to draw a trendline in lower time frame based on higher time frame trend? "
1. Trendlines indicate the best fit of some data using a single line or curve.
2. A single trendline can be applied to a chart to give a clearer picture of the trend.
3. Trendlines can be applied to the highs and the lows to create a channel.
4. The time period being analyzed and the exact points used to create a trendline vary from trader to trader.
Remarks
Free but closed sourced.
The drawing may fail if your current resolution is already in large time frame.
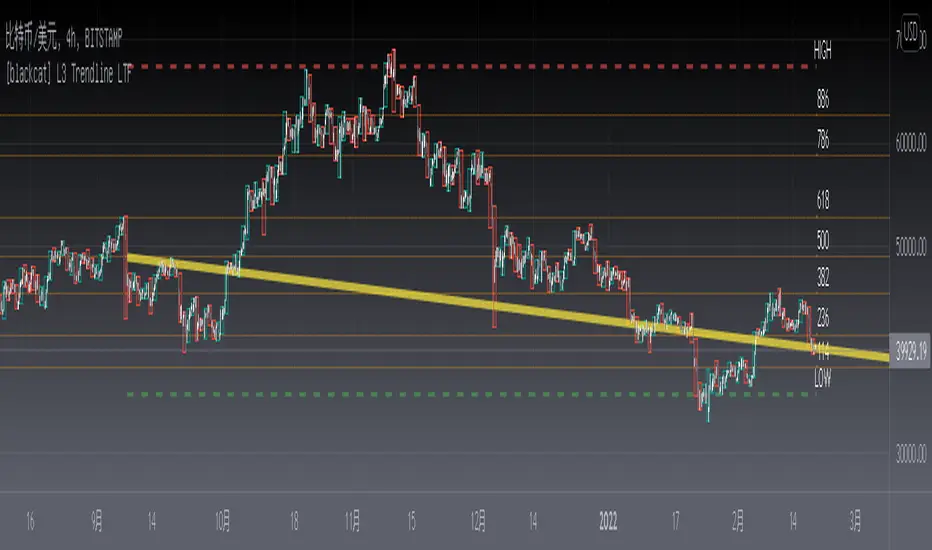
If the trendline is not drawn but you can see the red resistance and green support dashed lines, please drag the the chart to the left unitl you see the yellow solid trend line appears.
Background
Trendlines are easily recognizable lines that traders draw on charts to connect a series of prices together or show some data's best fit. The resulting line is then used to give the trader a good idea of the direction in which an investment's value might move. A trendline is a line drawn over pivot highs or under pivot lows to show the prevailing direction of price. Trendlines are a visual representation of support and resistance in any time frame. They show direction and speed of price, and also describe patterns during periods of price contraction.
Function
This is a noval low time frame (LTF) trendline which was inquired from TradingView community. "How to draw a trendline in lower time frame based on higher time frame trend? "
1. Trendlines indicate the best fit of some data using a single line or curve.
2. A single trendline can be applied to a chart to give a clearer picture of the trend.
3. Trendlines can be applied to the highs and the lows to create a channel.
4. The time period being analyzed and the exact points used to create a trendline vary from trader to trader.
Remarks
Free but closed sourced.
The drawing may fail if your current resolution is already in large time frame.
If the trendline is not drawn but you can see the red resistance and green support dashed lines, please drag the the chart to the left unitl you see the yellow solid trend line appears.
릴리즈 노트
Add powerful Fibonacci levels as well릴리즈 노트
Adjust Fibo level linewith for better view릴리즈 노트
correct backbars default value보호된 스크립트입니다
이 스크립트는 비공개 소스로 게시됩니다. 하지만 이를 자유롭게 제한 없이 사용할 수 있습니다 – 자세한 내용은 여기에서 확인하세요.
Avoid losing contact!Don't miss out! The first and most important thing to do is to join my Discord chat now! Click here to start your adventure: discord.com/invite/ZTGpQJq 防止失联,请立即行动,加入本猫聊天群: discord.com/invite/ZTGpQJq
면책사항
해당 정보와 게시물은 금융, 투자, 트레이딩 또는 기타 유형의 조언이나 권장 사항으로 간주되지 않으며, 트레이딩뷰에서 제공하거나 보증하는 것이 아닙니다. 자세한 내용은 이용 약관을 참조하세요.
보호된 스크립트입니다
이 스크립트는 비공개 소스로 게시됩니다. 하지만 이를 자유롭게 제한 없이 사용할 수 있습니다 – 자세한 내용은 여기에서 확인하세요.
Avoid losing contact!Don't miss out! The first and most important thing to do is to join my Discord chat now! Click here to start your adventure: discord.com/invite/ZTGpQJq 防止失联,请立即行动,加入本猫聊天群: discord.com/invite/ZTGpQJq
면책사항
해당 정보와 게시물은 금융, 투자, 트레이딩 또는 기타 유형의 조언이나 권장 사항으로 간주되지 않으며, 트레이딩뷰에서 제공하거나 보증하는 것이 아닙니다. 자세한 내용은 이용 약관을 참조하세요.