OPEN-SOURCE SCRIPT
Stochastic RSI rainbow in fibonacci sequence using VWMA
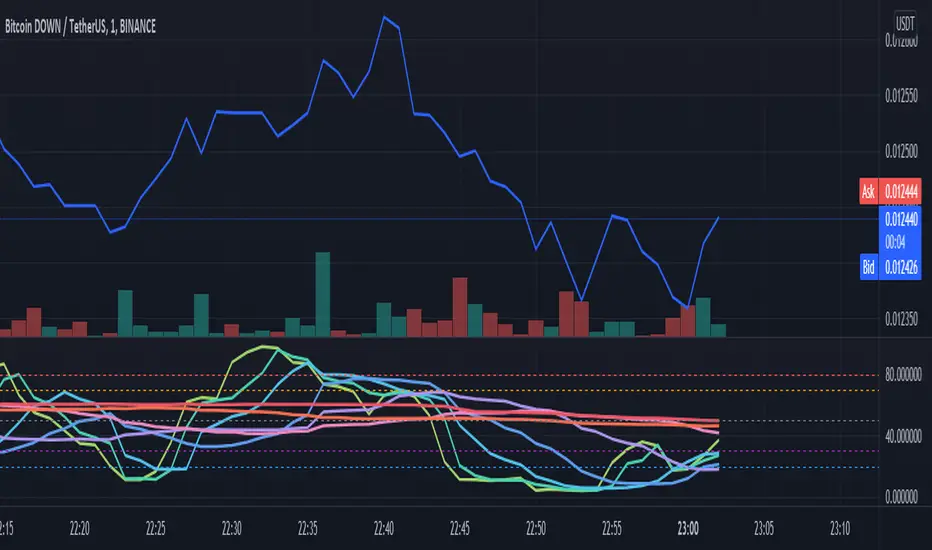
The standard stochastic RSI gives limited information as it only contains two reference lines. This Stochastic RSI rainbow contains more lines in shorter timeframes and progressively fewer as the reference time increase. This is done in a FIB sequence 2,3,8,13,21,34,55.... The shorter timeframes are more reactive to current market conditions indicating recent price action and the longer lines represent more significant periods of time. The indicator uses VWMA for its calculations (volume weighted moving average)
HOW TO USE THIS INDICATOR:
When multiple lines are above, either 70 or 80, you can consider the commodity overbought, or OB. The more lines that are above the threshhold, the more significant the signal. The same is true in inverse. In addition, you can use each cross to signify a buy/sell signal according to the type and quantity of trading you are doing. If you are looking to get in and out quickly you can use the lower timeframe signals.
OPTIONS:
You can change what data is used for the VWMA calculation... Of course, you can select colors and other properties as well.
오픈 소스 스크립트
트레이딩뷰의 진정한 정신에 따라, 이 스크립트의 작성자는 이를 오픈소스로 공개하여 트레이더들이 기능을 검토하고 검증할 수 있도록 했습니다. 작성자에게 찬사를 보냅니다! 이 코드는 무료로 사용할 수 있지만, 코드를 재게시하는 경우 하우스 룰이 적용된다는 점을 기억하세요.
면책사항
해당 정보와 게시물은 금융, 투자, 트레이딩 또는 기타 유형의 조언이나 권장 사항으로 간주되지 않으며, 트레이딩뷰에서 제공하거나 보증하는 것이 아닙니다. 자세한 내용은 이용 약관을 참조하세요.
오픈 소스 스크립트
트레이딩뷰의 진정한 정신에 따라, 이 스크립트의 작성자는 이를 오픈소스로 공개하여 트레이더들이 기능을 검토하고 검증할 수 있도록 했습니다. 작성자에게 찬사를 보냅니다! 이 코드는 무료로 사용할 수 있지만, 코드를 재게시하는 경우 하우스 룰이 적용된다는 점을 기억하세요.
면책사항
해당 정보와 게시물은 금융, 투자, 트레이딩 또는 기타 유형의 조언이나 권장 사항으로 간주되지 않으며, 트레이딩뷰에서 제공하거나 보증하는 것이 아닙니다. 자세한 내용은 이용 약관을 참조하세요.