OPEN-SOURCE SCRIPT
업데이트됨 Dynamic Liquidity Map [Kioseff Trading]
Hello!
Just a quick/fun project here: "Dynamic Heatmap".
This script draws a volume delta or open interest delta heatmap for the asset on your chart.
The adjective "Dynamic" is used for two reasons (:
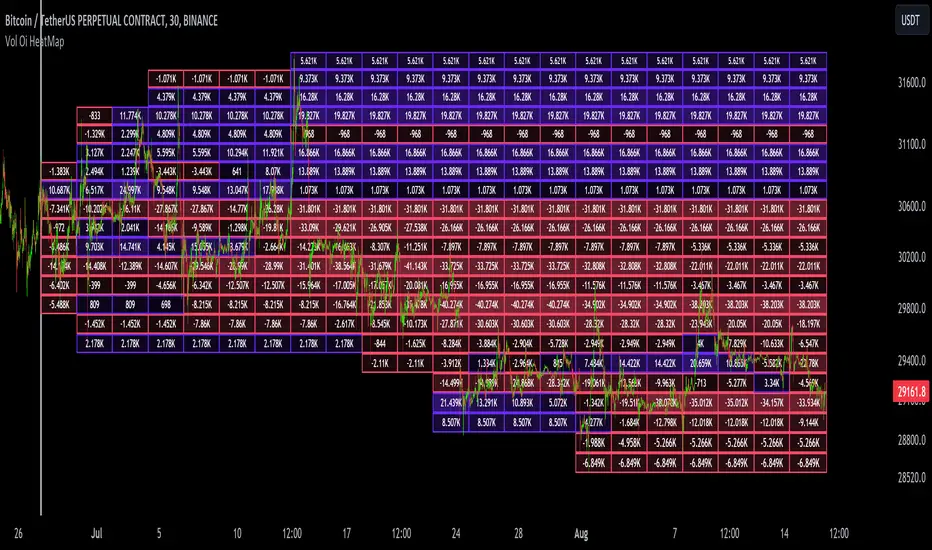
1: Self-Adjusting Lower Timeframe Data
The script requests ~10 lower timeframe volume and open interest data sets.
When using the fixed range feature the script will, beginning at the start time, check the ~10 requested lower timeframes to see which of the lower timeframes has available data.
The script will always use the lowest timeframe available during the calculation period. As time continues, the script will continue to check if new lower timeframe data (lower than the currently used lowest timeframe) is available. This process repeats until bar time is close enough to the current time that 1-minute data can be retrieved.

The image above exemplifies the process.
Incrementally lower timeframe data will be used as it becomes available.
1: Fixed range capabilities
The script features a "fixed range" tool, where you can manually set a start time (or drag & drop a bar on the chart) to determine the interval the heatmap covers.
From the start date, the script will calculate the calculate the sub-intervals necessary to draw a rows x columns heatmap. Consequently, setting the start time further back will draw a heat map with larger rows x columns, whereas, a start time closer to the current bar time will draw a more "precise" heatmap with smaller rows x columns.
Additionally, the heatmap can be calculated using open interest data.

The image above shows the heatmap displaying open interest delta.

The image above shows alternative settings for the heatmap.
Delta values have been hidden alongside grid border colors. These settings can be replicated to achieve a more "traditional" feel for the heatmap.
Thanks for checking this out!
Just a quick/fun project here: "Dynamic Heatmap".
This script draws a volume delta or open interest delta heatmap for the asset on your chart.
The adjective "Dynamic" is used for two reasons (:
1: Self-Adjusting Lower Timeframe Data
The script requests ~10 lower timeframe volume and open interest data sets.
When using the fixed range feature the script will, beginning at the start time, check the ~10 requested lower timeframes to see which of the lower timeframes has available data.
The script will always use the lowest timeframe available during the calculation period. As time continues, the script will continue to check if new lower timeframe data (lower than the currently used lowest timeframe) is available. This process repeats until bar time is close enough to the current time that 1-minute data can be retrieved.
The image above exemplifies the process.
Incrementally lower timeframe data will be used as it becomes available.
1: Fixed range capabilities
The script features a "fixed range" tool, where you can manually set a start time (or drag & drop a bar on the chart) to determine the interval the heatmap covers.
From the start date, the script will calculate the calculate the sub-intervals necessary to draw a rows x columns heatmap. Consequently, setting the start time further back will draw a heat map with larger rows x columns, whereas, a start time closer to the current bar time will draw a more "precise" heatmap with smaller rows x columns.
Additionally, the heatmap can be calculated using open interest data.
The image above shows the heatmap displaying open interest delta.
The image above shows alternative settings for the heatmap.
Delta values have been hidden alongside grid border colors. These settings can be replicated to achieve a more "traditional" feel for the heatmap.
Thanks for checking this out!
릴리즈 노트
Fixed timeframe.period issueThank you Trendoscope for noticing (:
릴리즈 노트
Fixed bug with oi data! Thank you again for noticing Trendoscope
오픈 소스 스크립트
트레이딩뷰의 진정한 정신에 따라, 이 스크립트의 작성자는 이를 오픈소스로 공개하여 트레이더들이 기능을 검토하고 검증할 수 있도록 했습니다. 작성자에게 찬사를 보냅니다! 이 코드는 무료로 사용할 수 있지만, 코드를 재게시하는 경우 하우스 룰이 적용된다는 점을 기억하세요.
•Access to Next-Gen Optimization Tools: tradingiq.io
•Discord Server: discord.gg/aKWPuM4HPy
•Discord Server: discord.gg/aKWPuM4HPy
면책사항
해당 정보와 게시물은 금융, 투자, 트레이딩 또는 기타 유형의 조언이나 권장 사항으로 간주되지 않으며, 트레이딩뷰에서 제공하거나 보증하는 것이 아닙니다. 자세한 내용은 이용 약관을 참조하세요.