OPEN-SOURCE SCRIPT
업데이트됨 Trend lines
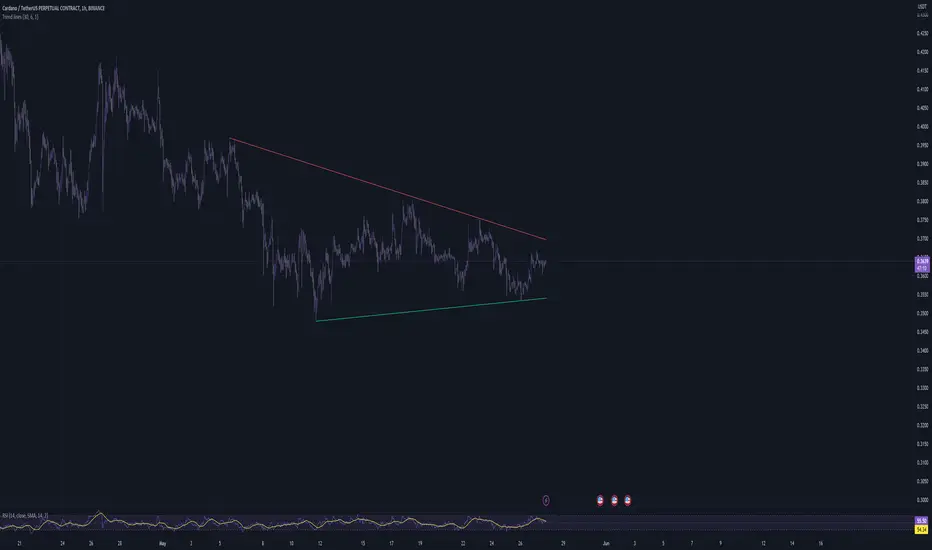
This script aims to identify and plot trend lines and pivot points on a price chart, with the aim of facilitating technical analysis for trading.
The script allows users to configure a number of parameters including the period for Pivot Points, the maximum number of pivots, and the maximum number of trend lines.
Pivot points (local highs and lows in the price data) are identified using TradingView's built-in pivot high and pivot low functions. The identified pivot points are then stored in arrays. The script also optionally plots these points on the chart.
The main goal of the script is to find and plot trend lines based on the pivot points. For each pair of pivot points, it computes the slope of the line connecting them. If all the other pivot points are below this line (for downward trends) or above this line (for upward trends), the line is considered a valid trend line.
The script also includes a feature that suggests potential "buy" or "sell" points along the trend lines. When the price touches the trend line, a label indicating a potential trading action (buy or sell) is created on the chart.
릴리즈 노트
fixed a problem where the line crosses the price and doesnt dissapear. 릴리즈 노트
changed reference image릴리즈 노트
changes to make it a little bit faster릴리즈 노트
- removed signals because this indicator does not need them- updated logic
- added different colors for lines
오픈 소스 스크립트
트레이딩뷰의 진정한 정신에 따라, 이 스크립트의 작성자는 이를 오픈소스로 공개하여 트레이더들이 기능을 검토하고 검증할 수 있도록 했습니다. 작성자에게 찬사를 보냅니다! 이 코드는 무료로 사용할 수 있지만, 코드를 재게시하는 경우 하우스 룰이 적용된다는 점을 기억하세요.
면책사항
해당 정보와 게시물은 금융, 투자, 트레이딩 또는 기타 유형의 조언이나 권장 사항으로 간주되지 않으며, 트레이딩뷰에서 제공하거나 보증하는 것이 아닙니다. 자세한 내용은 이용 약관을 참조하세요.
오픈 소스 스크립트
트레이딩뷰의 진정한 정신에 따라, 이 스크립트의 작성자는 이를 오픈소스로 공개하여 트레이더들이 기능을 검토하고 검증할 수 있도록 했습니다. 작성자에게 찬사를 보냅니다! 이 코드는 무료로 사용할 수 있지만, 코드를 재게시하는 경우 하우스 룰이 적용된다는 점을 기억하세요.
면책사항
해당 정보와 게시물은 금융, 투자, 트레이딩 또는 기타 유형의 조언이나 권장 사항으로 간주되지 않으며, 트레이딩뷰에서 제공하거나 보증하는 것이 아닙니다. 자세한 내용은 이용 약관을 참조하세요.