PROTECTED SOURCE SCRIPT
JWAT INDY
Here’s a **professional, clear, and trader-friendly description** of your **Bollinger Band Mean Reversion Strategy**, written so you can use it in TradingView, a backtest report, or even in your trading plan document:
---
### 📊 **Bollinger Band Mean Reversion Strategy – Description**
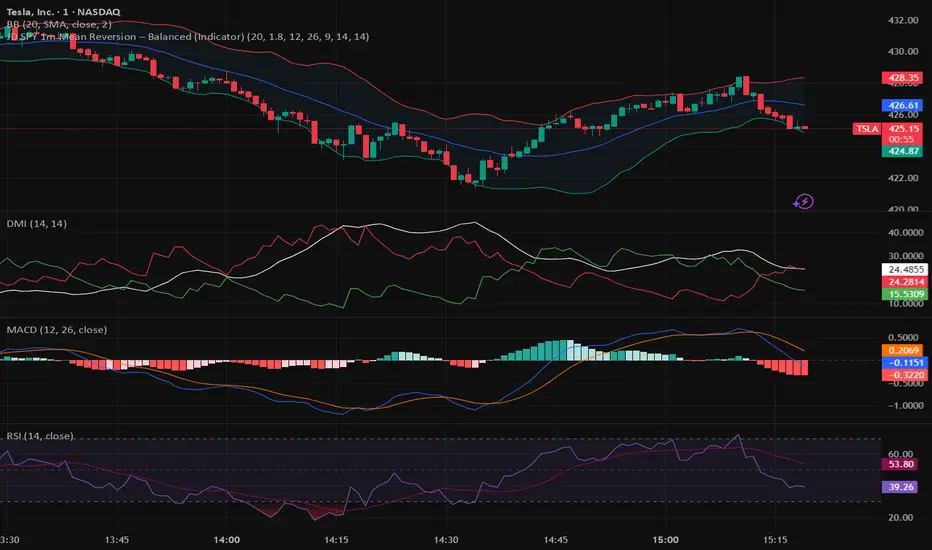
This strategy is designed to exploit short-term overextensions in price relative to its statistical mean using **Bollinger Bands** as the primary volatility framework. It assumes that when price deviates significantly from the mean (the middle band), market conditions are temporarily stretched, creating a high-probability opportunity for **reversion to the mean**.
The system uses a standard **20-period Bollinger Band** with a **2.0 standard-deviation multiplier** to define overbought and oversold zones. When price closes below the **lower band**, it signals potential exhaustion of selling pressure and triggers a **long (buy)** setup. Conversely, when price closes above the **upper band**, it indicates overbought conditions and triggers a **short (sell)** setup.
To improve trade quality and avoid false reversals, the strategy integrates **ADX (Average Directional Index)** or another trend filter to confirm that volatility expansion is not part of a strong trending move. Trades are taken only when the market is in a **low-to-moderate trend environment**, where mean-reverting behavior is statistically favored.
Each trade aims for a modest **take-profit target near the middle Bollinger Band (the moving average)**, representing a return to equilibrium, with a predefined **stop loss** beyond recent highs or lows to control risk. Position sizing can be dynamic—based on account equity or fixed contract size—to allow compounding through consistent percentage-based risk.
This approach is particularly effective on **short intraday timeframes (e.g., 1-minute or 5-minute SPY charts)**, where frequent oscillations occur within tight volatility bands. The goal is to capture small, repeatable edges from market overreactions while maintaining a strict discipline in trade execution and risk management.
---
### 🧩 **Key Features**
* Core indicator: **Bollinger Bands (20, 2.0)**
* Confirmation filter: **ADX threshold (e.g., <25)** to identify ranging conditions
* Entry logic:
* Long when price closes below lower band
* Short when price closes above upper band
* Exit logic:
* Take profit at the mid-band
* Stop loss beyond prior swing or fixed % distance
* Optional filters: Time of day, session volatility, or multi-timeframe trend confirmation
* Ideal for: **Mean-reversion scalping** on liquid instruments like SPY, QQQ, or futures
---
Would you like me to write a **shorter version (2–3 sentences)** for your TradingView strategy description box — or keep this **full detailed version** for a trading plan document or presentation?
---
### 📊 **Bollinger Band Mean Reversion Strategy – Description**
This strategy is designed to exploit short-term overextensions in price relative to its statistical mean using **Bollinger Bands** as the primary volatility framework. It assumes that when price deviates significantly from the mean (the middle band), market conditions are temporarily stretched, creating a high-probability opportunity for **reversion to the mean**.
The system uses a standard **20-period Bollinger Band** with a **2.0 standard-deviation multiplier** to define overbought and oversold zones. When price closes below the **lower band**, it signals potential exhaustion of selling pressure and triggers a **long (buy)** setup. Conversely, when price closes above the **upper band**, it indicates overbought conditions and triggers a **short (sell)** setup.
To improve trade quality and avoid false reversals, the strategy integrates **ADX (Average Directional Index)** or another trend filter to confirm that volatility expansion is not part of a strong trending move. Trades are taken only when the market is in a **low-to-moderate trend environment**, where mean-reverting behavior is statistically favored.
Each trade aims for a modest **take-profit target near the middle Bollinger Band (the moving average)**, representing a return to equilibrium, with a predefined **stop loss** beyond recent highs or lows to control risk. Position sizing can be dynamic—based on account equity or fixed contract size—to allow compounding through consistent percentage-based risk.
This approach is particularly effective on **short intraday timeframes (e.g., 1-minute or 5-minute SPY charts)**, where frequent oscillations occur within tight volatility bands. The goal is to capture small, repeatable edges from market overreactions while maintaining a strict discipline in trade execution and risk management.
---
### 🧩 **Key Features**
* Core indicator: **Bollinger Bands (20, 2.0)**
* Confirmation filter: **ADX threshold (e.g., <25)** to identify ranging conditions
* Entry logic:
* Long when price closes below lower band
* Short when price closes above upper band
* Exit logic:
* Take profit at the mid-band
* Stop loss beyond prior swing or fixed % distance
* Optional filters: Time of day, session volatility, or multi-timeframe trend confirmation
* Ideal for: **Mean-reversion scalping** on liquid instruments like SPY, QQQ, or futures
---
Would you like me to write a **shorter version (2–3 sentences)** for your TradingView strategy description box — or keep this **full detailed version** for a trading plan document or presentation?
보호된 스크립트입니다
이 스크립트는 비공개 소스로 게시됩니다. 하지만 이를 자유롭게 제한 없이 사용할 수 있습니다 – 자세한 내용은 여기에서 확인하세요.
면책사항
해당 정보와 게시물은 금융, 투자, 트레이딩 또는 기타 유형의 조언이나 권장 사항으로 간주되지 않으며, 트레이딩뷰에서 제공하거나 보증하는 것이 아닙니다. 자세한 내용은 이용 약관을 참조하세요.
보호된 스크립트입니다
이 스크립트는 비공개 소스로 게시됩니다. 하지만 이를 자유롭게 제한 없이 사용할 수 있습니다 – 자세한 내용은 여기에서 확인하세요.
면책사항
해당 정보와 게시물은 금융, 투자, 트레이딩 또는 기타 유형의 조언이나 권장 사항으로 간주되지 않으며, 트레이딩뷰에서 제공하거나 보증하는 것이 아닙니다. 자세한 내용은 이용 약관을 참조하세요.