OPEN-SOURCE SCRIPT
업데이트됨 Sizeblock
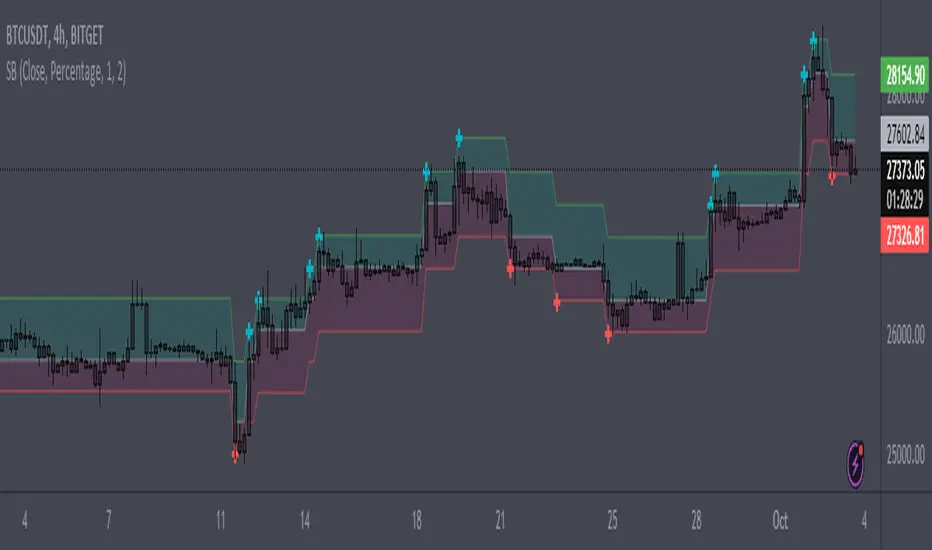
Price change indicator in the form of diagonal rows.
The calculation is based on the percentage or tick deviation of the price movement (indicated in the "Deviation" parameter), which is displayed on the chart in the form of rows.
The row consists of the base middle line, upper and lower limits:
The base middle line is equal to the upper or lower limits of the previous row (if the price changes rapidly in one time interval, then the base middle line of the current row is greater than the upper limit of the previous row or less than the lower limit of the previous row by an equal number of deviations depending on the direction of price movement). At the beginning of the calculation, the base middle line is equal to the initial value of the first row.
The "Quantity" parameter determines the deviation for the upper or lower limits depending on the direction of the price movement, and the "U-turn" parameter determines the deviation for changing the direction of the price movement.
The rule for constructing a new row:
By adjusting certain deviations, you can clearly see the local trend and reversal points on the chart.
A useful tool for tracking price direction.
Thanks for your attention!
The calculation is based on the percentage or tick deviation of the price movement (indicated in the "Deviation" parameter), which is displayed on the chart in the form of rows.
The row consists of the base middle line, upper and lower limits:
- The middle line is the basis for the upper and lower limits of the current row.
- The upper and lower limits are deviations from the base middle line of the current row.
The base middle line is equal to the upper or lower limits of the previous row (if the price changes rapidly in one time interval, then the base middle line of the current row is greater than the upper limit of the previous row or less than the lower limit of the previous row by an equal number of deviations depending on the direction of price movement). At the beginning of the calculation, the base middle line is equal to the initial value of the first row.
The "Quantity" parameter determines the deviation for the upper or lower limits depending on the direction of the price movement, and the "U-turn" parameter determines the deviation for changing the direction of the price movement.
The rule for constructing a new row:
- The "Source" parameter accepts, depending on the choice, the price of high, low values or the closing price from the time interval of the chart.
- When the price reaches the upper or lower limits of the row and goes beyond them, a new row is formed with the same parameters for deviation of the upper and lower limits from the base middle line, depending on the direction of price movement.
By adjusting certain deviations, you can clearly see the local trend and reversal points on the chart.
A useful tool for tracking price direction.
Thanks for your attention!
릴리즈 노트
Updating code.릴리즈 노트
Updating chart.오픈 소스 스크립트
트레이딩뷰의 진정한 정신에 따라, 이 스크립트의 작성자는 이를 오픈소스로 공개하여 트레이더들이 기능을 검토하고 검증할 수 있도록 했습니다. 작성자에게 찬사를 보냅니다! 이 코드는 무료로 사용할 수 있지만, 코드를 재게시하는 경우 하우스 룰이 적용된다는 점을 기억하세요.
면책사항
해당 정보와 게시물은 금융, 투자, 트레이딩 또는 기타 유형의 조언이나 권장 사항으로 간주되지 않으며, 트레이딩뷰에서 제공하거나 보증하는 것이 아닙니다. 자세한 내용은 이용 약관을 참조하세요.
오픈 소스 스크립트
트레이딩뷰의 진정한 정신에 따라, 이 스크립트의 작성자는 이를 오픈소스로 공개하여 트레이더들이 기능을 검토하고 검증할 수 있도록 했습니다. 작성자에게 찬사를 보냅니다! 이 코드는 무료로 사용할 수 있지만, 코드를 재게시하는 경우 하우스 룰이 적용된다는 점을 기억하세요.
면책사항
해당 정보와 게시물은 금융, 투자, 트레이딩 또는 기타 유형의 조언이나 권장 사항으로 간주되지 않으며, 트레이딩뷰에서 제공하거나 보증하는 것이 아닙니다. 자세한 내용은 이용 약관을 참조하세요.