OPEN-SOURCE SCRIPT
업데이트됨 Leverage Liquidation Circles/dots/alerts
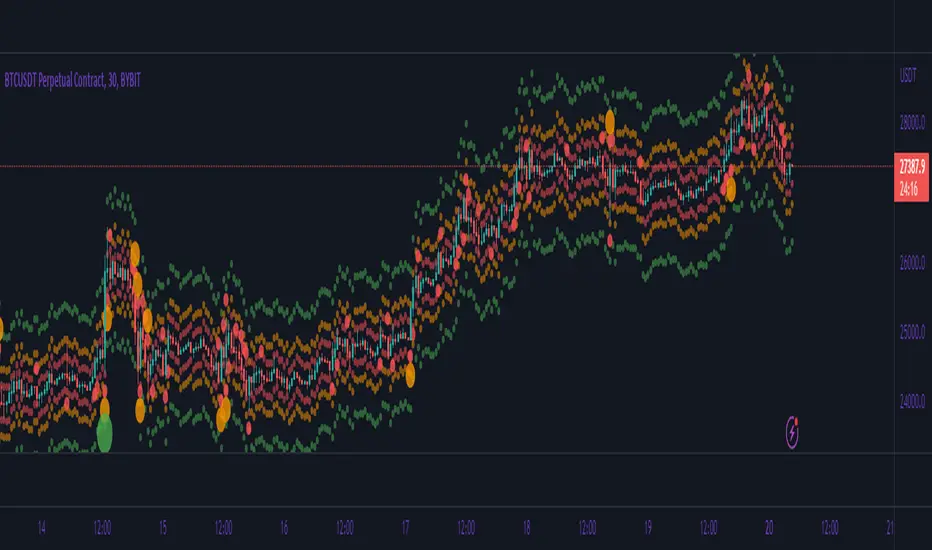
This plots liquidation alerts for different levels of leverage. The script calculates the liquidation prices for both long and short positions based on the inputted leverage values. Then, it plots dots on the chart where liquidation can occur for each level of leverage. Additionally, it plots circles on the chart only when a liquidation event occurs, at which point the circle changes color to indicate the level of leverage that triggered the liquidation.
The script allows traders to visualize potential liquidation events for different levels of leverage, which can be helpful in managing risk when trading on margin. The different colors of the circles can quickly communicate which level of leverage triggered the liquidation, allowing traders to quickly assess the situation and adjust their positions if necessary.
The script allows traders to visualize potential liquidation events for different levels of leverage, which can be helpful in managing risk when trading on margin. The different colors of the circles can quickly communicate which level of leverage triggered the liquidation, allowing traders to quickly assess the situation and adjust their positions if necessary.
릴리즈 노트
added highlight on high concentration of dots. still work in progress릴리즈 노트
added past liquidation levels. they act as magnets for liquidity + updating to pine v5릴리즈 노트
removed some features not meant to be added. added feature that makes dots not visible on the timeframes bigger than 1 hour
릴리즈 노트
added more lev circlesadded highlights before vol
오픈 소스 스크립트
트레이딩뷰의 진정한 정신에 따라, 이 스크립트의 작성자는 이를 오픈소스로 공개하여 트레이더들이 기능을 검토하고 검증할 수 있도록 했습니다. 작성자에게 찬사를 보냅니다! 이 코드는 무료로 사용할 수 있지만, 코드를 재게시하는 경우 하우스 룰이 적용된다는 점을 기억하세요.
~matt
면책사항
해당 정보와 게시물은 금융, 투자, 트레이딩 또는 기타 유형의 조언이나 권장 사항으로 간주되지 않으며, 트레이딩뷰에서 제공하거나 보증하는 것이 아닙니다. 자세한 내용은 이용 약관을 참조하세요.
오픈 소스 스크립트
트레이딩뷰의 진정한 정신에 따라, 이 스크립트의 작성자는 이를 오픈소스로 공개하여 트레이더들이 기능을 검토하고 검증할 수 있도록 했습니다. 작성자에게 찬사를 보냅니다! 이 코드는 무료로 사용할 수 있지만, 코드를 재게시하는 경우 하우스 룰이 적용된다는 점을 기억하세요.
~matt
면책사항
해당 정보와 게시물은 금융, 투자, 트레이딩 또는 기타 유형의 조언이나 권장 사항으로 간주되지 않으며, 트레이딩뷰에서 제공하거나 보증하는 것이 아닙니다. 자세한 내용은 이용 약관을 참조하세요.