PROTECTED SOURCE SCRIPT
업데이트됨 Max Stop Loss - Risk Management Visualizer
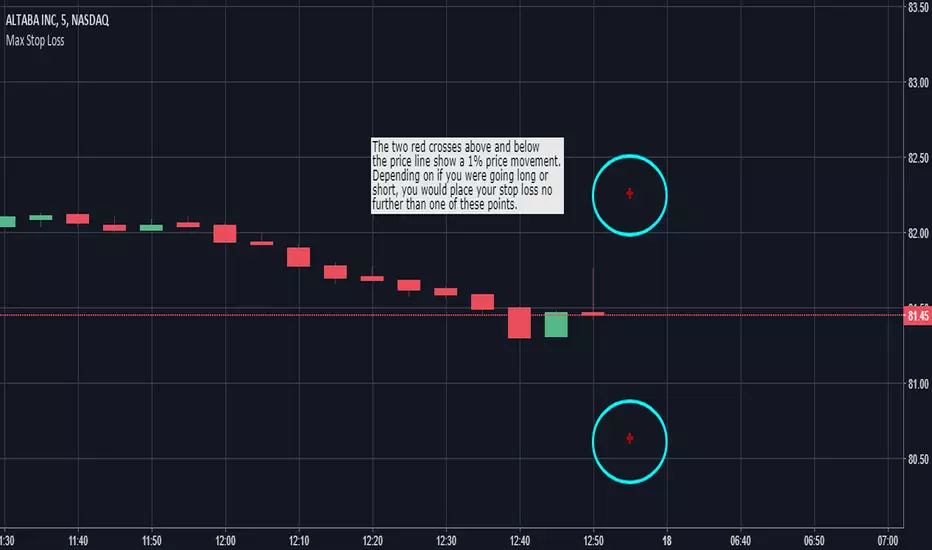
This indicator helps traders implement proper risk management in their trading. For example, let's say that you were trading a $1,000 account and didn't want to risk more than 1% of your account on any one trade. If you were placing $100 positions, you wouldn't want the price to move more than 10% against you (10% of $100 is $10, which is 1% of $1,000). So, assuming you were trading without any leverage, you would put "1000" into the "Max Stop Loss %" field in the format box and the indicator would display red crosses 10% above and below the current price of the market you are looking at. If you were going to take that same trade with 10x leverage, you would want to enter "100" into the indicator's format box and the red crosses would then plot themselves 1% above and below the current price.
"Max Stop Loss - Risk Management Visualizer" is able to show all the way down to a 0.01% price variation with no upper limit.
"Max Stop Loss - Risk Management Visualizer" is able to show all the way down to a 0.01% price variation with no upper limit.
릴리즈 노트
************ UPDATE ************I have added additional fields in the Format box. You can now enter your total funds, how large your lot size will be, your maximum acceptable loss, as well as if you're using any leverage. The indicator will then do the math to calculate everything out for you.
Note, the Max Loss % is based on your TOTAL ACCOUNT. So, if you had a $1,000 account and set the indicator to 1%, "Max Stop Loss - Risk Management Visualizer" will display crosses that would put you at losing no more than $10/trade, regardless of your Lot Size and Leverage. How far the price could move before hitting that 1% will be affected by your Lot Size and Leverage, though.
So, let's assume that you're using the $1,000 account size with a 1% risk parameters. If you are buying a $100 lot with no leverage, the price would have to go against you by 10% in order for you to lose 1% of your account ($10). If you were trading with 10x leverage, though, the price would only have to go against you by 1%. That's why those parameters are now included in the indicator's Format box.
릴리즈 노트
*Updated again to get the example chart to display correctly*보호된 스크립트입니다
이 스크립트는 비공개 소스로 게시됩니다. 하지만 이를 자유롭게 제한 없이 사용할 수 있습니다 – 자세한 내용은 여기에서 확인하세요.
면책사항
해당 정보와 게시물은 금융, 투자, 트레이딩 또는 기타 유형의 조언이나 권장 사항으로 간주되지 않으며, 트레이딩뷰에서 제공하거나 보증하는 것이 아닙니다. 자세한 내용은 이용 약관을 참조하세요.
보호된 스크립트입니다
이 스크립트는 비공개 소스로 게시됩니다. 하지만 이를 자유롭게 제한 없이 사용할 수 있습니다 – 자세한 내용은 여기에서 확인하세요.
면책사항
해당 정보와 게시물은 금융, 투자, 트레이딩 또는 기타 유형의 조언이나 권장 사항으로 간주되지 않으며, 트레이딩뷰에서 제공하거나 보증하는 것이 아닙니다. 자세한 내용은 이용 약관을 참조하세요.