OPEN-SOURCE SCRIPT
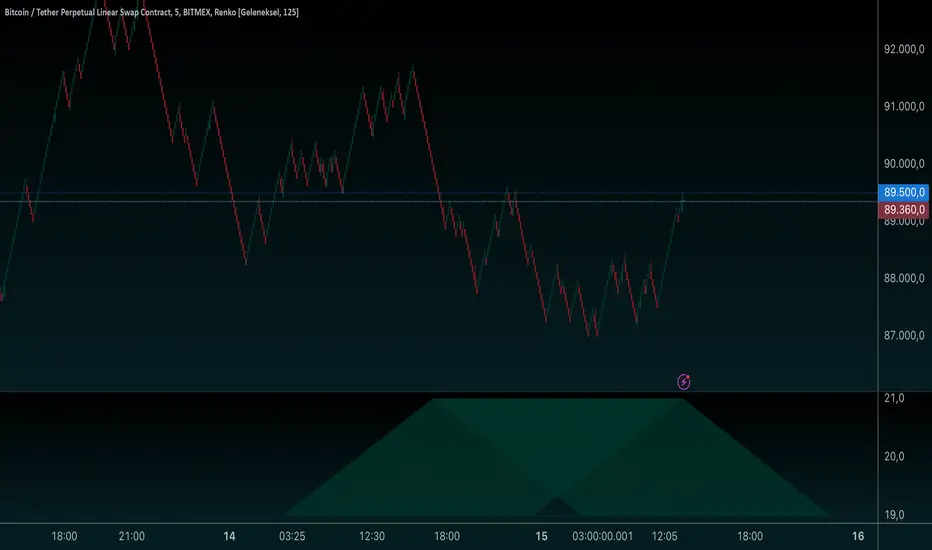
Platonic Solids Visualization-Scret Geometry-AYNET

Explanation:
Input Options:
solid: Choose the type of Platonic Solid (Tetrahedron, Cube, Octahedron, etc.).
size: Adjust the size of the geometry.
color_lines: Choose the color for the edges.
line_width: Set the width of the edges.
Geometry Calculations:
Each solid is drawn based on predefined coordinates and connected using the line.new function.
Geometric Types Supported:
Tetrahedron: A triangular pyramid.
Cube: A square-based 2D projection.
Octahedron: Two pyramids joined at the base.
Unsupported Solids:
Dodecahedron and Icosahedron are geometrically more complex and not rendered in this basic implementation.
Visualization:
The chosen Platonic Solid will be drawn relative to the center position (center_y) on the chart.
Adjust the size and center_y inputs to position the shape correctly.
Let me know if you need improvements or have a specific geometry to implement!
오픈 소스 스크립트
트레이딩뷰의 진정한 정신에 따라, 이 스크립트의 작성자는 이를 오픈소스로 공개하여 트레이더들이 기능을 검토하고 검증할 수 있도록 했습니다. 작성자에게 찬사를 보냅니다! 이 코드는 무료로 사용할 수 있지만, 코드를 재게시하는 경우 하우스 룰이 적용된다는 점을 기억하세요.
면책사항
해당 정보와 게시물은 금융, 투자, 트레이딩 또는 기타 유형의 조언이나 권장 사항으로 간주되지 않으며, 트레이딩뷰에서 제공하거나 보증하는 것이 아닙니다. 자세한 내용은 이용 약관을 참조하세요.
오픈 소스 스크립트
트레이딩뷰의 진정한 정신에 따라, 이 스크립트의 작성자는 이를 오픈소스로 공개하여 트레이더들이 기능을 검토하고 검증할 수 있도록 했습니다. 작성자에게 찬사를 보냅니다! 이 코드는 무료로 사용할 수 있지만, 코드를 재게시하는 경우 하우스 룰이 적용된다는 점을 기억하세요.
면책사항
해당 정보와 게시물은 금융, 투자, 트레이딩 또는 기타 유형의 조언이나 권장 사항으로 간주되지 않으며, 트레이딩뷰에서 제공하거나 보증하는 것이 아닙니다. 자세한 내용은 이용 약관을 참조하세요.