PROTECTED SOURCE SCRIPT
Trend Table MTF – Customizable PRO
Trend Table MTF – Customizable PRO
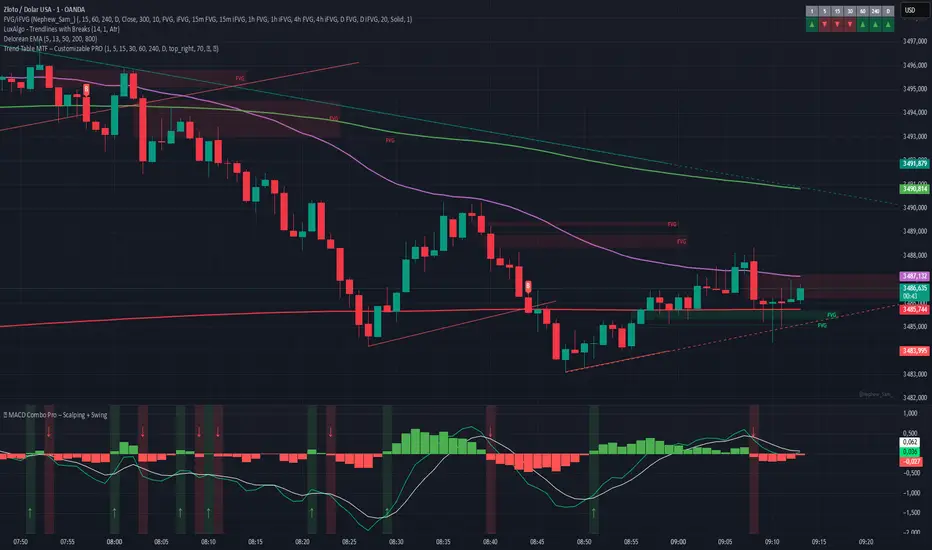
The Trend Table MTF – Customizable PRO is a powerful visual tool that helps traders instantly monitor multi-timeframe trend direction using a simple and clean table display.
Perfect for scalpers, intraday, and swing traders, this indicator offers a bird’s eye view of the market trend across multiple timeframes – all in a compact format.
🔍 Features:
✅ 7 Timeframes (fully customizable: 1m, 5m, 15m, 30m, 1h, 4h, 1D by default)
✅ Trend Detection via price vs EMA 20 (customizable logic possible)
✅ Custom Table Positioning (Top/Bottom, Left/Right)
✅ Adjustable Background Transparency
✅ Fully Customizable Colors:
Background
Text
Uptrend Arrow Color (▲)
Downtrend Arrow Color (▼)
Uptrend Background Color
Downtrend Background Color
✅ Arrow Symbols for quick trend recognition
✅ Works on any asset and timeframe
🎯 How It Works:
The indicator compares the current price to the 20-period EMA on each selected timeframe.
If Price > EMA, it's considered an Uptrend (▲).
If Price < EMA, it's a Downtrend (▼).
You get immediate color-coded visual feedback in the table with customizable arrows and background colors.
📊 Use Cases:
🔹 Confirm trend alignment before entering trades
🔹 Spot momentum shifts across timeframes
🔹 Combine with your scalping or swing strategy for extra confidence
🔹 Perfect companion to your price action or volume indicators
🧩 Pro Tips:
Combine this with MACD, RSI, or Liquidity Zones for powerful confluence
Use table transparency to avoid visual clutter on your chart
Choose high-contrast colors for quick glance recognition
보호된 스크립트입니다
이 스크립트는 비공개 소스로 게시됩니다. 하지만 제한 없이 자유롭게 사용할 수 있습니다 — 여기에서 자세히 알아보기.
면책사항
이 정보와 게시물은 TradingView에서 제공하거나 보증하는 금융, 투자, 거래 또는 기타 유형의 조언이나 권고 사항을 의미하거나 구성하지 않습니다. 자세한 내용은 이용 약관을 참고하세요.
보호된 스크립트입니다
이 스크립트는 비공개 소스로 게시됩니다. 하지만 제한 없이 자유롭게 사용할 수 있습니다 — 여기에서 자세히 알아보기.
면책사항
이 정보와 게시물은 TradingView에서 제공하거나 보증하는 금융, 투자, 거래 또는 기타 유형의 조언이나 권고 사항을 의미하거나 구성하지 않습니다. 자세한 내용은 이용 약관을 참고하세요.