OPEN-SOURCE SCRIPT
Volatility % Bands (O→C)
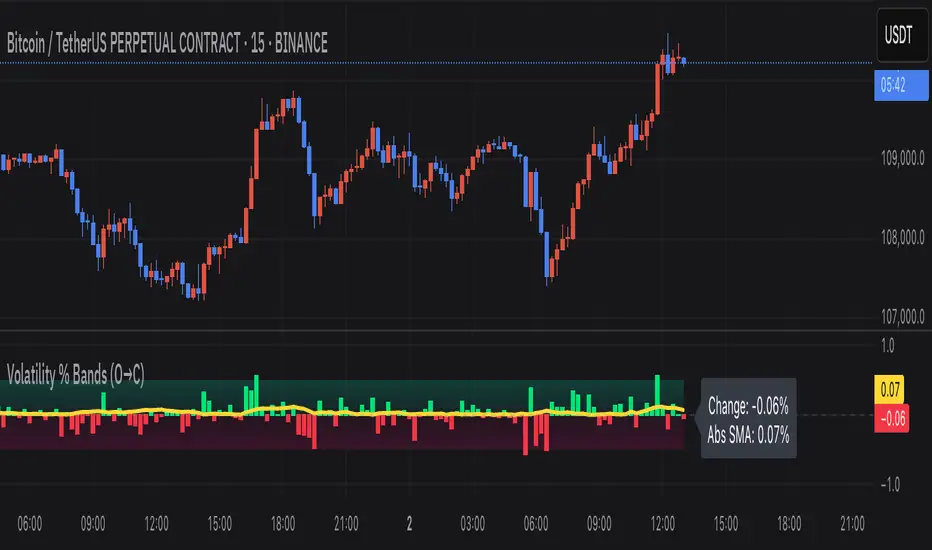
Volatility % Bands (O→C) is an indicator designed to visualize the percentage change from Open to Close of each candle, providing a clear view of short-term momentum and volatility.
This tool can be useful for volatility breakout strategies, day trading, and short-term momentum analysis.
- **Histogram**: Displays bar-by-bar % change (Close vs Open). Green bars indicate positive changes, while red bars indicate negative ones, making momentum shifts easy to identify.
- **Moving Average Line**: Plots the Simple Moving Average (SMA) of the absolute % change, helping traders track the average volatility over a chosen period.
- **Background Bands**: Based on the user-defined Level Step, ±1 to ±5 zones are highlighted as shaded bands, allowing quick recognition of whether volatility is low, moderate, or extreme.
- **Label**: Shows the latest candle’s % change and the current SMA value as a floating label on the right, making it convenient for real-time monitoring.
This tool can be useful for volatility breakout strategies, day trading, and short-term momentum analysis.
오픈 소스 스크립트
트레이딩뷰의 진정한 정신에 따라, 이 스크립트의 작성자는 이를 오픈소스로 공개하여 트레이더들이 기능을 검토하고 검증할 수 있도록 했습니다. 작성자에게 찬사를 보냅니다! 이 코드는 무료로 사용할 수 있지만, 코드를 재게시하는 경우 하우스 룰이 적용된다는 점을 기억하세요.
비트코인 선물 매매를 2년 정도 했으며, 수익 추구도 좋지만 시장 분석 자체를 즐겨하는 편입니다.
면책사항
해당 정보와 게시물은 금융, 투자, 트레이딩 또는 기타 유형의 조언이나 권장 사항으로 간주되지 않으며, 트레이딩뷰에서 제공하거나 보증하는 것이 아닙니다. 자세한 내용은 이용 약관을 참조하세요.