OPEN-SOURCE SCRIPT
업데이트됨 RSI with Close & Tail Divergences

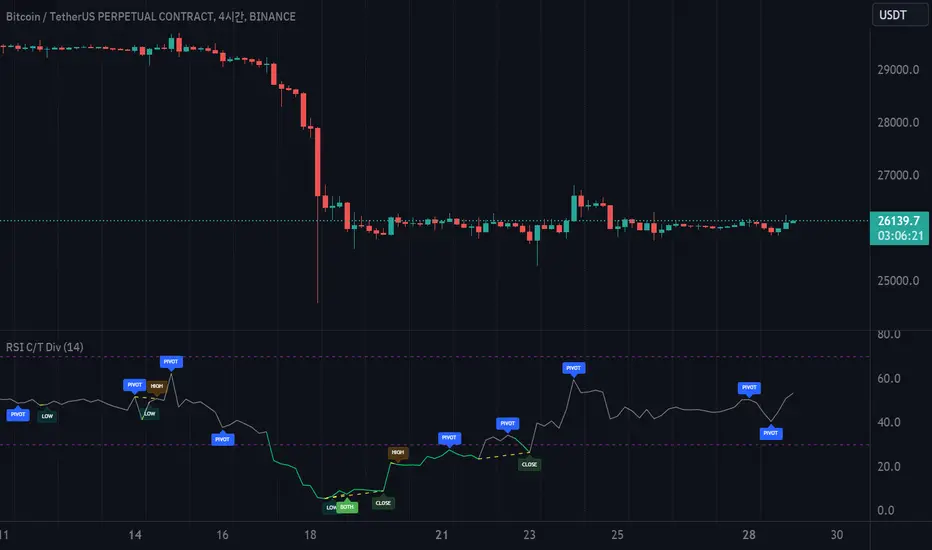
RSI divergence is a cornerstone signal for both stock and cryptocurrency traders, renowned for its reliability.
The basis for measuring divergence can vary:
Depending on the criteria selected, the resultant signals can be markedly different.
Our innovative indicator offers:
With this tool, traders are empowered to make informed decisions, anchored in precise divergence cues.
This indicator boasts the following capabilities:

The basis for measuring divergence can vary:
- Historically, it's been determined by the candlestick's closing price.
- However, a contemporary approach uses the tail values, specifically the high and low prices, of the candlestick.
Depending on the criteria selected, the resultant signals can be markedly different.
Our innovative indicator offers:
- Divergence tracking based on the closing price of the candlestick.
- Divergence tracking considering the candlestick's peak and trough values.
- A unique convergence of both types of divergence signals.
With this tool, traders are empowered to make informed decisions, anchored in precise divergence cues.
This indicator boasts the following capabilities:
- Displays divergence based on closing price, highs/lows, as well as a unique combined criterion.
- Highlights pivot points.
- Denotes divergence spots on the RSI chart with lines.
- Offers a background color representation instead of labels.
릴리즈 노트
RSI divergence is a cornerstone signal for both stock and cryptocurrency traders, renowned for its reliability.The basis for measuring divergence can vary:
- Historically, it's been determined by the candlestick's closing price.
- However, a contemporary approach uses the tail values, specifically the high and low prices, of the candlestick.
Depending on the criteria selected, the resultant signals can be markedly different.
Our innovative indicator offers:
- Divergence tracking based on the closing price of the candlestick.
- Divergence tracking considering the candlestick's peak and trough values.
- A unique convergence of both types of divergence signals.
With this tool, traders are empowered to make informed decisions, anchored in precise divergence cues.
This indicator boasts the following capabilities:
- Displays divergence based on closing price, highs/lows, as well as a unique combined criterion.
- Highlights pivot points.
- Denotes divergence spots on the RSI chart with lines.
- Offers a background color representation instead of labels.
오픈 소스 스크립트
트레이딩뷰의 진정한 정신에 따라, 이 스크립트의 작성자는 이를 오픈소스로 공개하여 트레이더들이 기능을 검토하고 검증할 수 있도록 했습니다. 작성자에게 찬사를 보냅니다! 이 코드는 무료로 사용할 수 있지만, 코드를 재게시하는 경우 하우스 룰이 적용된다는 점을 기억하세요.
면책사항
해당 정보와 게시물은 금융, 투자, 트레이딩 또는 기타 유형의 조언이나 권장 사항으로 간주되지 않으며, 트레이딩뷰에서 제공하거나 보증하는 것이 아닙니다. 자세한 내용은 이용 약관을 참조하세요.
오픈 소스 스크립트
트레이딩뷰의 진정한 정신에 따라, 이 스크립트의 작성자는 이를 오픈소스로 공개하여 트레이더들이 기능을 검토하고 검증할 수 있도록 했습니다. 작성자에게 찬사를 보냅니다! 이 코드는 무료로 사용할 수 있지만, 코드를 재게시하는 경우 하우스 룰이 적용된다는 점을 기억하세요.
면책사항
해당 정보와 게시물은 금융, 투자, 트레이딩 또는 기타 유형의 조언이나 권장 사항으로 간주되지 않으며, 트레이딩뷰에서 제공하거나 보증하는 것이 아닙니다. 자세한 내용은 이용 약관을 참조하세요.