OPEN-SOURCE SCRIPT
업데이트됨 Candle Theory
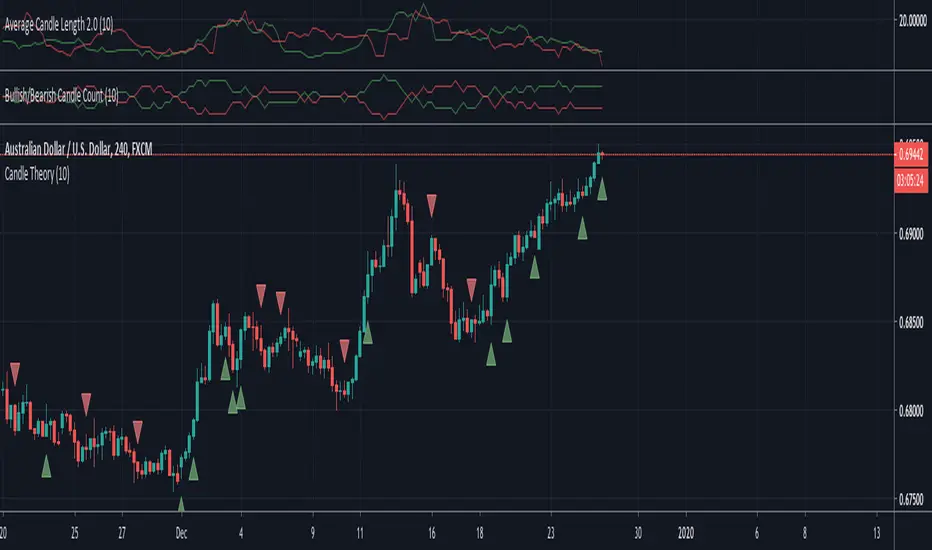
Description: The theory behind this script is that if within the last 10 candles, if the majority of them are green and the average length (wick to wick) of those majority green candles is greater than the average length of the minority red candles then it will signal that this is a bullish move within the market and signal you to buy. The opposite is true for bearish moves.
Inputs:
Inputs:
- Length - this allows you to decide how many candles to look back, default/recommended is 10
- Show First Signal In Series Only - using this indicator without this checked will show many more signals in a row. This allows you to just get a signal for the first candle that is the predicted bullish or bearish move
릴리즈 노트
Adding in an alertcondition that allows you to set up one alert for short or long signals rather than having to set up two different alerts.오픈 소스 스크립트
트레이딩뷰의 진정한 정신에 따라, 이 스크립트의 작성자는 이를 오픈소스로 공개하여 트레이더들이 기능을 검토하고 검증할 수 있도록 했습니다. 작성자에게 찬사를 보냅니다! 이 코드는 무료로 사용할 수 있지만, 코드를 재게시하는 경우 하우스 룰이 적용된다는 점을 기억하세요.
면책사항
해당 정보와 게시물은 금융, 투자, 트레이딩 또는 기타 유형의 조언이나 권장 사항으로 간주되지 않으며, 트레이딩뷰에서 제공하거나 보증하는 것이 아닙니다. 자세한 내용은 이용 약관을 참조하세요.
오픈 소스 스크립트
트레이딩뷰의 진정한 정신에 따라, 이 스크립트의 작성자는 이를 오픈소스로 공개하여 트레이더들이 기능을 검토하고 검증할 수 있도록 했습니다. 작성자에게 찬사를 보냅니다! 이 코드는 무료로 사용할 수 있지만, 코드를 재게시하는 경우 하우스 룰이 적용된다는 점을 기억하세요.
면책사항
해당 정보와 게시물은 금융, 투자, 트레이딩 또는 기타 유형의 조언이나 권장 사항으로 간주되지 않으며, 트레이딩뷰에서 제공하거나 보증하는 것이 아닙니다. 자세한 내용은 이용 약관을 참조하세요.