PROTECTED SOURCE SCRIPT
Normalized Candle Spread with MA
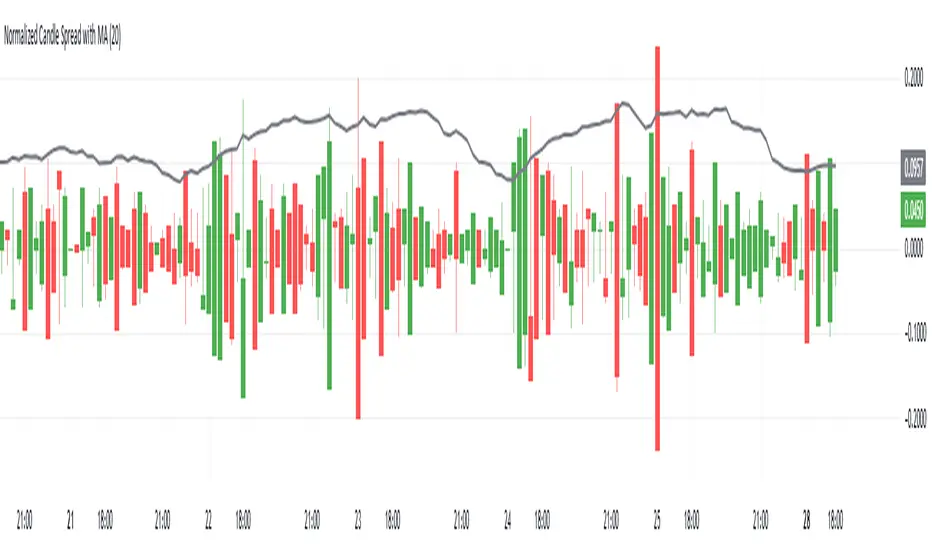
This Pine Script indicator, "Normalized Candle Spread with MA," visualizes candle price action by normalizing the candle bodies and wicks around a baseline (zero level). The normalization centers each candle’s high, low, open, and close prices relative to its own spread (high minus low), so all candles are plotted on the same horizontal line for easy comparison of their shapes and relative sizes.
Key features:
Normalization: Adjusts candle components (open, close, high, low) so they are centered around zero, allowing the comparison of candle shapes regardless of their absolute price levels.
Candle colors: Green for bullish candles (close ≥ open) and red for bearish candles (close < open).
Spread Moving Average: Plots a simple moving average (SMA) of the candle spreads over a user-defined period for visual reference of average volatility.
This indicator helps traders visually assess candle volatility and structure normalized over time, rather than focusing on price levels.
보호된 스크립트입니다
이 스크립트는 비공개 소스로 게시됩니다. 하지만 제한 없이 자유롭게 사용할 수 있습니다 — 여기에서 자세히 알아보기.
면책사항
이 정보와 게시물은 TradingView에서 제공하거나 보증하는 금융, 투자, 거래 또는 기타 유형의 조언이나 권고 사항을 의미하거나 구성하지 않습니다. 자세한 내용은 이용 약관을 참고하세요.
보호된 스크립트입니다
이 스크립트는 비공개 소스로 게시됩니다. 하지만 제한 없이 자유롭게 사용할 수 있습니다 — 여기에서 자세히 알아보기.
면책사항
이 정보와 게시물은 TradingView에서 제공하거나 보증하는 금융, 투자, 거래 또는 기타 유형의 조언이나 권고 사항을 의미하거나 구성하지 않습니다. 자세한 내용은 이용 약관을 참고하세요.