INVITE-ONLY SCRIPT
E³ Up-Down Volume % (NASDAQ)
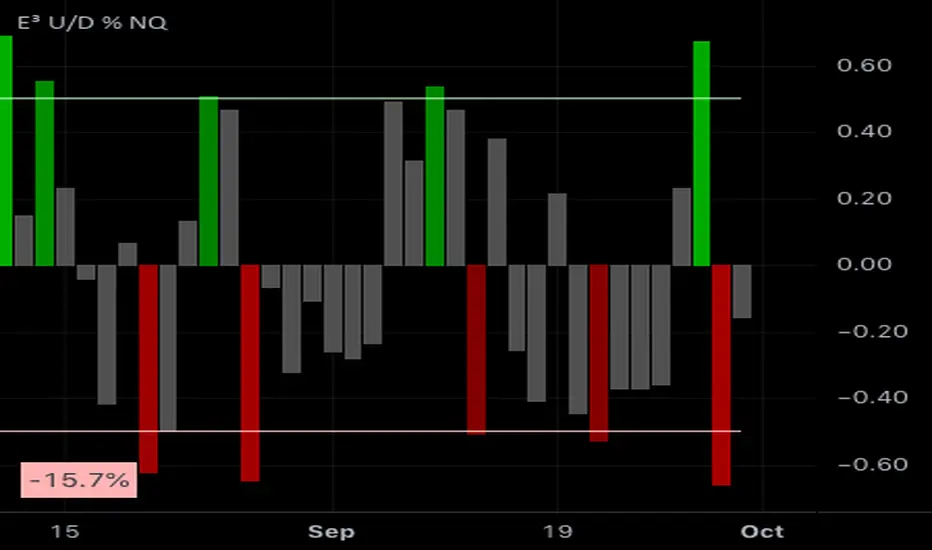
This lower indicator will show what % a day's total market volume on the NASDAQ COMPOSITE is bullish or bearish. It shows a history of every day's reading on a lower indicator pane.
Strong readings correspond to strong days and the differential in volume can often be ascertained from the market open and in the first 5-30 minutes of the market, to give you a sense of how the market might play out that day.
It is especially good at predicting STRONGEST days as well as DOJI days (indecision days).
EXAMPLES:
TECHNICALLY:
90% bullish = 95% of the volume on the day is UP (very rare, ie: once every 2+ years)
80% bullish = 90% of the volume is UP (rare, ie: once or twice a year)
50% bullish = 75% of volume is UP (significant when it occurs, but not uncommon)
0-1% bullish = 50% of volume is up
-50% bearish = 75% of the volume is DOWN
-80% bearish = 90% of the volume is DOWN
-90% bearish = 95% of the volume is DOWN
OPTIMUM SETTINGS = Threshold Percent to 45-55%
This means that roughly 3/4 of the volume transpiring(ed) on the day is either UP or DOWN and will color the histogram if levels are that strong (either bullish or bearish)
Strong readings correspond to strong days and the differential in volume can often be ascertained from the market open and in the first 5-30 minutes of the market, to give you a sense of how the market might play out that day.
It is especially good at predicting STRONGEST days as well as DOJI days (indecision days).
EXAMPLES:
- A +1% reading would mean that there is 1% more up volume on the day than down volume, meaning it's nearly a DOJI day or indecisive day where up down volume is basically 50/50 and the day is not particularly bullish (or bearish). Same goes for a very low bearish reading such as -1%.
- an 80% BULLISH reading would mean that the day's volume differential is hugely favoring the bullside (buying demand). These days are so strong in sentiment that they usually end up being STRONG BULLISH CONTINUATION candles with little to no topside wick by the end of the day.
- Conversely an 80% bearish candle would mean an intensely strong sell-side volume day.
TECHNICALLY:
90% bullish = 95% of the volume on the day is UP (very rare, ie: once every 2+ years)
80% bullish = 90% of the volume is UP (rare, ie: once or twice a year)
50% bullish = 75% of volume is UP (significant when it occurs, but not uncommon)
0-1% bullish = 50% of volume is up
-50% bearish = 75% of the volume is DOWN
-80% bearish = 90% of the volume is DOWN
-90% bearish = 95% of the volume is DOWN
OPTIMUM SETTINGS = Threshold Percent to 45-55%
This means that roughly 3/4 of the volume transpiring(ed) on the day is either UP or DOWN and will color the histogram if levels are that strong (either bullish or bearish)
초대 전용 스크립트
이 스크립트는 작성자가 승인한 사용자만 접근할 수 있습니다. 사용하려면 요청 후 승인을 받아야 하며, 일반적으로 결제 후에 허가가 부여됩니다. 자세한 내용은 아래 작성자의 안내를 따르거나 evanevansmusic에게 직접 문의하세요.
트레이딩뷰는 스크립트의 작동 방식을 충분히 이해하고 작성자를 완전히 신뢰하지 않는 이상, 해당 스크립트에 비용을 지불하거나 사용하는 것을 권장하지 않습니다. 커뮤니티 스크립트에서 무료 오픈소스 대안을 찾아보실 수도 있습니다.
작성자 지시 사항
HOW TO PUT ON YOUR CHARTS:
Find out how to get this indicator for your charts here:
https://www.e3tradinggroup.com
+517% in 1 year! 🏆 30+ yrs Experience🥇Top Verified Trader on Profit.ly/evanevans ⚡Day Trader, Swing Trader, Mentor
면책사항
해당 정보와 게시물은 금융, 투자, 트레이딩 또는 기타 유형의 조언이나 권장 사항으로 간주되지 않으며, 트레이딩뷰에서 제공하거나 보증하는 것이 아닙니다. 자세한 내용은 이용 약관을 참조하세요.