INVITE-ONLY SCRIPT
OB Liquidity Suite
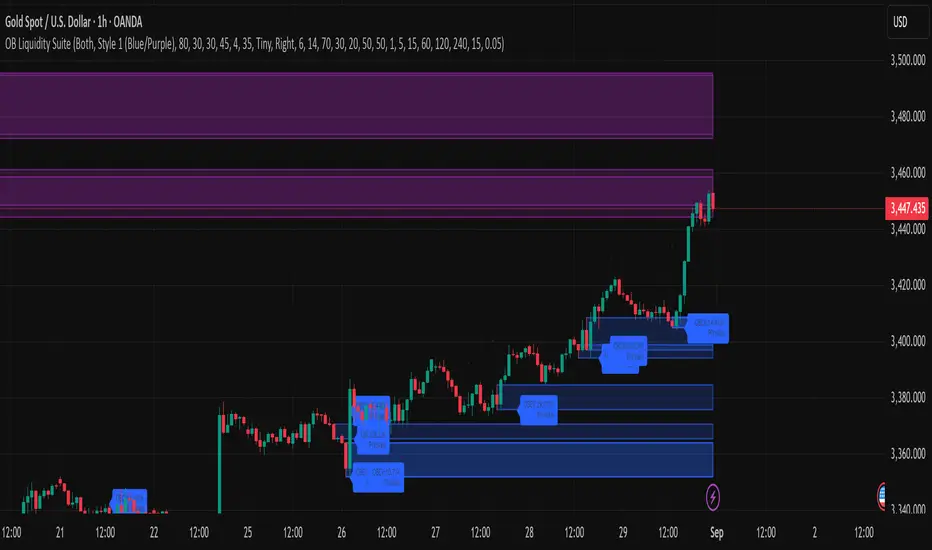
Title: OB Liquidity Suite
Description:
1. Indicator Overview and Core Concept
The OB Liquidity Suite is an advanced technical analysis tool designed to automatically identify, draw, and analyze high-probability Order Blocks (OBs). It moves beyond simple candle identification by integrating sophisticated confirmation criteria, volume profiling analysis, and multi-timeframe context.
The core philosophy is to provide traders with a comprehensive toolkit for Order Block trading, allowing for deep customization to fit various strategies. The indicator not only plots the OBs but also enriches them with crucial data points like institutional volume clusters, VPOC/TPO levels, and dynamic heatmap coloring, transforming a standard OB into a multi-dimensional zone of interest.
2. The Two Types of Order Block Detection
The indicator employs two distinct, user-selectable algorithms for identifying Order Blocks, each based on a different definition of "momentum shift":
OB1 - Close-to-Close Rate of Change (C2C ROC): This method identifies an Order Block based on a significant percentage change between the close of two consecutive candles. A bullish OB is identified on the last down-candle before a strong upward move, defined by ta.crossover of the ROC value against a user-defined sensitivity threshold (OB1 C2C ROC Sensitivity). This method is excellent for capturing sharp, momentum-driven reversals.
OB2 - Open-to-Lookback-Open Rate of Change (O-LB ROC): This method identifies an Order Block by comparing the current candle's open price to the open price of a previous candle (OB2 Lookback). This is designed to detect broader structural shifts rather than immediate momentum. A bullish OB is identified on the last down-candle preceding a significant upward structural change.
3. Multi-Layered Box Visualization
This indicator's key feature is its ability to draw up to four distinct boxes for each Order Block, providing a layered analytical view. These modules can be enabled individually for each OB type:
Main OB Box: The standard Order Block, defined by the high and low of the identified candle.
Institutional Range / Cluster Box: This is a powerful, data-driven feature. The indicator analyzes the price action before the Order Block was formed, looking for a consolidation range characterized by high volume and RSI extremes. This "cluster" represents a zone of probable institutional accumulation or distribution, adding significant weight to the OB.
VPOC (Volume Point of Control) Box: The indicator samples price and volume data from lower timeframes to calculate the VPOC for the price range of the Order Block. It then draws a box representing a 1-standard-deviation probability zone around this high-volume node.
TPO (Time Price Opportunity) Box: Similar to VPOC, this module calculates the TPO midpoint (the price level with the most time spent) and draws a probability zone around it, offering a time-based perspective on price acceptance.
4. Dynamic Heatmap and Color Styling
To provide an at-a-glance understanding of volume, the indicator includes a dynamic heatmap feature.
Heatmap Background: When enabled, the fill color of the Order Block boxes is dynamically calculated based on the total volume within that OB relative to the recent maximum and minimum volume (Heatmap Volume Lookback). Faint colors indicate low volume, while intense, opaque colors signify high volume, instantly highlighting the most significant OBs.
Customizable Color Styles: The indicator includes four preset color themes (e.g., Blue/Purple, Yellow/Gray) and a "Custom" style that allows the user to define every color manually for full personalization.
5. Higher Timeframe (HTF) Confirmation
To ensure signals align with the broader market trend, the indicator includes an optional HTF confirmation module. When enabled, it will only draw Order Blocks that are confirmed by a corresponding bullish or bearish signal on a user-selected higher timeframe. It can also plot these HTF confirmation levels directly on the chart.
6. Alerts and Labels
Comprehensive Alerts: Alerts can be configured for multiple events:
When a new Order Block is formed.
When price touches the boundary of an existing OB.
When an OB is broken or invalidated by price.
When price touches a confirmed HTF level.
Detailed Volume Labels: Optional labels can be displayed for each OB, showing a breakdown of the OB's own volume, the calculated institutional volume, and the total combined volume
초대 전용 스크립트
이 스크립트는 작성자가 승인한 사용자만 접근할 수 있습니다. 사용하려면 요청을 보내고 승인을 받아야 합니다. 일반적으로 결제 후에 승인이 이루어집니다. 자세한 내용은 아래 작성자의 지침을 따르거나 shadyshaban에게 직접 문의하세요.
트레이딩뷰는 스크립트 작성자를 완전히 신뢰하고 스크립트 작동 방식을 이해하지 않는 한 스크립트 비용을 지불하거나 사용하지 않는 것을 권장하지 않습니다. 무료 오픈소스 대체 스크립트는 커뮤니티 스크립트에서 찾을 수 있습니다.
작성자 지시 사항
📲 لطلب صلاحية استخدام المؤشر، تواصل معنا عبر تيليجرام: 👉 @GoldAIChannel To request access to this script, contact us on Telegram: 👉 @GoldAIChannel
경고: 액세스를 요청하기 앞서 초대 전용 스크립트에 대한 가이드를 읽어주세요.
면책사항
이 정보와 게시물은 TradingView에서 제공하거나 보증하는 금융, 투자, 거래 또는 기타 유형의 조언이나 권고 사항을 의미하거나 구성하지 않습니다. 자세한 내용은 이용 약관을 참고하세요.