OPEN-SOURCE SCRIPT
업데이트됨 Dynamic Market Scanner
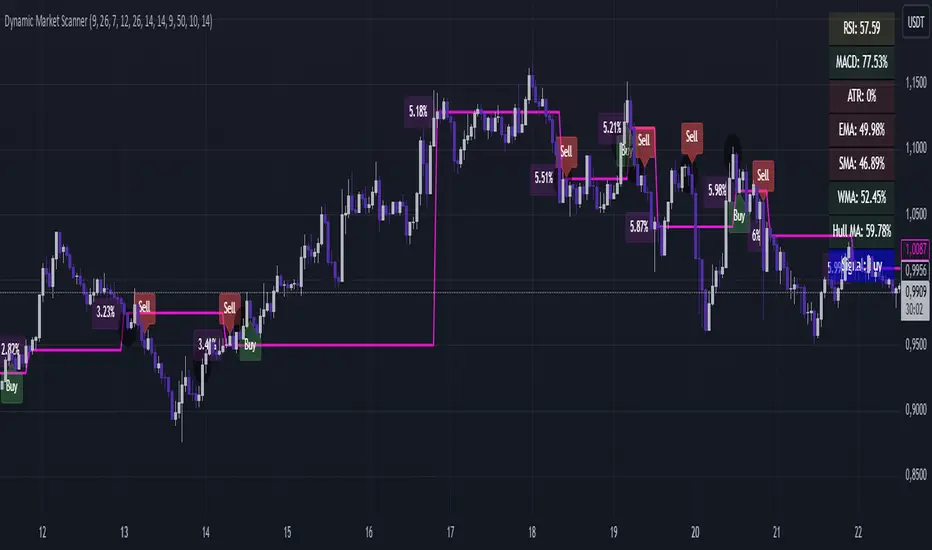
Dynamic Market Scanner is a powerful tool for analyzing financial markets, combining a variety of indicators to provide clear and understandable signals.
Key Features:
- Signal Generation:
The main signals "Buy", "Sell", and "Hold" are formed based on the analysis of indicators:
- MACD
- RSI
- SMA
- EMA
- WMA
- Hull MA
Additional Analytical Tools:
- ATR is used to assess volatility and helps to understand the risk of the current market situation.
- SMA Ichimoku does not generate signals but is used to assess their accuracy.
- If the price is above the SMA, "Buy" signals are more likely, as this confirms the strength of the upward movement.
- If the price is below the SMA, "Buy" signals require additional confirmations.
Dashboard:
Displays the current price position relative to the indicators, helping the trader understand how strong or weak the current signals are.
Advantages of Using:
1. Signal Filtering:
The price position relative to the SMA Ichimoku helps to assess the likelihood of successful trades.
2. Volatility Analysis:
ATR provides additional information about risks and market fluctuations.
3. Comprehensive Approach:
Signal generation is based on a combination of key indicators, offering a multifaceted view of the market.
Explanation of Percent Calculation in the Table:
- The table shows the values of indicators such as MACD, ATR, EMA, SMA, WMA, and Hull MA in percentages. Percentages are calculated based on the current value of the indicator relative to its maximum and minimum.
- Percentages are displayed for each indicator, allowing traders to assess market conditions based on their current values.
Dynamic Market Scanner will become a reliable assistant in your technical analysis toolkit, providing a comprehensive overview of market conditions and helping to make informed trading decisions.
릴리즈 노트
"SMA Ichimoku Crosses" IndicatorPrice Maximum Deviation Analysis:
Added calculation of the maximum percentage deviation of the price from the SMA (between Ichimoku crosses).
Helps assess volatility and identify potential risk levels.
Deviation History Storage:
Introduced the ability to analyze maximum deviations over recent periods (parameter Number of Breaks).
Deviation data is stored, allowing better analysis of price behavior over time.
Dynamic SMA Update:
The average price (avgPrice) is now fixed at the crossover point and used for subsequent calculations.
This helps to more accurately identify key levels on the chart.
Deviation Labels Display:
At each crossover, the indicator now displays a label showing the average maximum deviation over the selected period.
Provides a clear visual representation of market volatility.
This update makes the indicator more informative and useful for analyzing market conditions.
오픈 소스 스크립트
트레이딩뷰의 진정한 정신에 따라, 이 스크립트의 작성자는 이를 오픈소스로 공개하여 트레이더들이 기능을 검토하고 검증할 수 있도록 했습니다. 작성자에게 찬사를 보냅니다! 이 코드는 무료로 사용할 수 있지만, 코드를 재게시하는 경우 하우스 룰이 적용된다는 점을 기억하세요.
면책사항
해당 정보와 게시물은 금융, 투자, 트레이딩 또는 기타 유형의 조언이나 권장 사항으로 간주되지 않으며, 트레이딩뷰에서 제공하거나 보증하는 것이 아닙니다. 자세한 내용은 이용 약관을 참조하세요.
오픈 소스 스크립트
트레이딩뷰의 진정한 정신에 따라, 이 스크립트의 작성자는 이를 오픈소스로 공개하여 트레이더들이 기능을 검토하고 검증할 수 있도록 했습니다. 작성자에게 찬사를 보냅니다! 이 코드는 무료로 사용할 수 있지만, 코드를 재게시하는 경우 하우스 룰이 적용된다는 점을 기억하세요.
면책사항
해당 정보와 게시물은 금융, 투자, 트레이딩 또는 기타 유형의 조언이나 권장 사항으로 간주되지 않으며, 트레이딩뷰에서 제공하거나 보증하는 것이 아닙니다. 자세한 내용은 이용 약관을 참조하세요.