OPEN-SOURCE SCRIPT
업데이트됨 AntoQQE - Bars
This script is a variation on the QQE (Quantitative Qualitative Estimation) concept applied to RSI. It calculates a smoothed RSI line, then determines a “Dynamic Average Range” around that line. By tracking the RSI’s movement relative to these upper (shortBand) and lower (longBand) levels, it determines when price momentum shifts enough to suggest a possible trend flip. The script plots color-coded candles based on these momentum conditions:
• RSI Calculation and Smoothing
An RSI value is obtained over a specified period, then smoothed by an EMA. This smoothed RSI serves as the core measure of momentum.
• Dynamic Average Range (DAR)
The script computes the volatility of the smoothed RSI using two EMAs of its bar-to-bar movements. It multiplies this volatility factor by a QQE multiplier to create upper and lower bands that adapt to changes in RSI volatility.
• Trend Flips
When the smoothed RSI crosses above or below its previous band level (shortBand or longBand), the script interprets this as a shift in momentum and sets a trend state accordingly (long or short).
• Candle Coloring
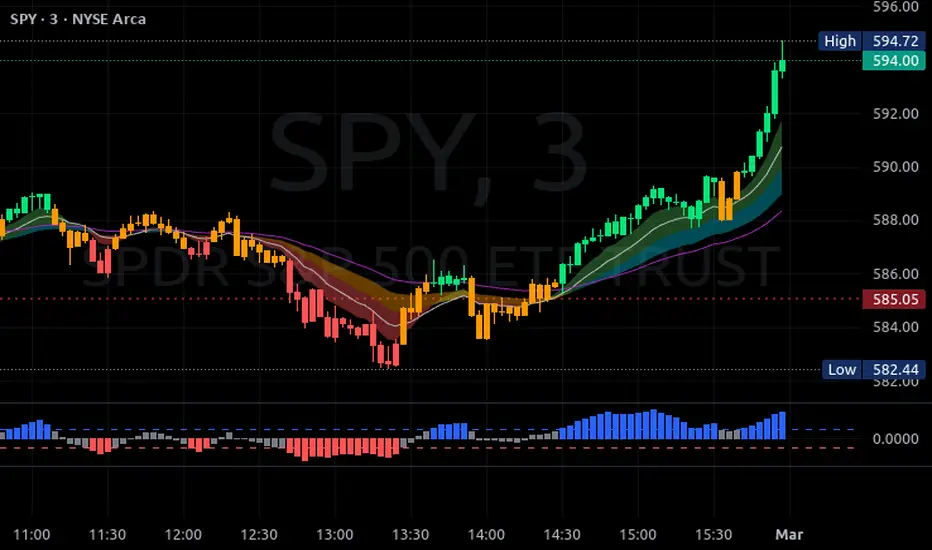
Finally, the script colors each candle according to how far the smoothed RSI is from a neutral baseline of 50:
Candles turn green when the RSI is sufficiently above 50, suggesting bullish momentum.
Candles turn red when the RSI is sufficiently below 50, indicating bearish momentum.
Candles turn orange when they are near the 50 level, reflecting a more neutral or transitional phase.
Traders can use these colored candles to quickly see when the RSI’s momentum has moved into overbought/oversold zones—or is shifting between bullish and bearish conditions—without needing to consult a separate oscillator window. The adaptive nature of the band calculations can help in spotting significant shifts in market sentiment and volatility.
• RSI Calculation and Smoothing
An RSI value is obtained over a specified period, then smoothed by an EMA. This smoothed RSI serves as the core measure of momentum.
• Dynamic Average Range (DAR)
The script computes the volatility of the smoothed RSI using two EMAs of its bar-to-bar movements. It multiplies this volatility factor by a QQE multiplier to create upper and lower bands that adapt to changes in RSI volatility.
• Trend Flips
When the smoothed RSI crosses above or below its previous band level (shortBand or longBand), the script interprets this as a shift in momentum and sets a trend state accordingly (long or short).
• Candle Coloring
Finally, the script colors each candle according to how far the smoothed RSI is from a neutral baseline of 50:
Candles turn green when the RSI is sufficiently above 50, suggesting bullish momentum.
Candles turn red when the RSI is sufficiently below 50, indicating bearish momentum.
Candles turn orange when they are near the 50 level, reflecting a more neutral or transitional phase.
Traders can use these colored candles to quickly see when the RSI’s momentum has moved into overbought/oversold zones—or is shifting between bullish and bearish conditions—without needing to consult a separate oscillator window. The adaptive nature of the band calculations can help in spotting significant shifts in market sentiment and volatility.
릴리즈 노트
This script is a variation on the QQE (Quantitative Qualitative Estimation) concept applied to RSI. It calculates a smoothed RSI line, then determines a “Dynamic Average Range” around that line. By tracking the RSI’s movement relative to these upper (shortBand) and lower (longBand) levels, it determines when price momentum shifts enough to suggest a possible trend flip. The script plots color-coded candles based on these momentum conditions:• RSI Calculation and Smoothing
An RSI value is obtained over a specified period, then smoothed by an EMA. This smoothed RSI serves as the core measure of momentum.
• Dynamic Average Range (DAR)
The script computes the volatility of the smoothed RSI using two EMAs of its bar-to-bar movements. It multiplies this volatility factor by a QQE multiplier to create upper and lower bands that adapt to changes in RSI volatility.
• Trend Flips
When the smoothed RSI crosses above or below its previous band level (shortBand or longBand), the script interprets this as a shift in momentum and sets a trend state accordingly (long or short).
• Candle Coloring
Finally, the script colors each candle according to how far the smoothed RSI is from a neutral baseline of 50:
Candles turn green when the RSI is sufficiently above 50, suggesting bullish momentum.
Candles turn red when the RSI is sufficiently below 50, indicating bearish momentum.
Candles turn orange when they are near the 50 level, reflecting a more neutral or transitional phase.
Traders can use these colored candles to quickly see when the RSI’s momentum has moved into overbought/oversold zones—or is shifting between bullish and bearish conditions—without needing to consult a separate oscillator window, though the oscillator is available under AntoQQE - Histogram. The adaptive nature of the band calculations can help in spotting significant shifts in market sentiment and volatility.
오픈 소스 스크립트
트레이딩뷰의 진정한 정신에 따라, 이 스크립트의 작성자는 이를 오픈소스로 공개하여 트레이더들이 기능을 검토하고 검증할 수 있도록 했습니다. 작성자에게 찬사를 보냅니다! 이 코드는 무료로 사용할 수 있지만, 코드를 재게시하는 경우 하우스 룰이 적용된다는 점을 기억하세요.
면책사항
해당 정보와 게시물은 금융, 투자, 트레이딩 또는 기타 유형의 조언이나 권장 사항으로 간주되지 않으며, 트레이딩뷰에서 제공하거나 보증하는 것이 아닙니다. 자세한 내용은 이용 약관을 참조하세요.
오픈 소스 스크립트
트레이딩뷰의 진정한 정신에 따라, 이 스크립트의 작성자는 이를 오픈소스로 공개하여 트레이더들이 기능을 검토하고 검증할 수 있도록 했습니다. 작성자에게 찬사를 보냅니다! 이 코드는 무료로 사용할 수 있지만, 코드를 재게시하는 경우 하우스 룰이 적용된다는 점을 기억하세요.
면책사항
해당 정보와 게시물은 금융, 투자, 트레이딩 또는 기타 유형의 조언이나 권장 사항으로 간주되지 않으며, 트레이딩뷰에서 제공하거나 보증하는 것이 아닙니다. 자세한 내용은 이용 약관을 참조하세요.