OPEN-SOURCE SCRIPT
업데이트됨 VEMA_LTF
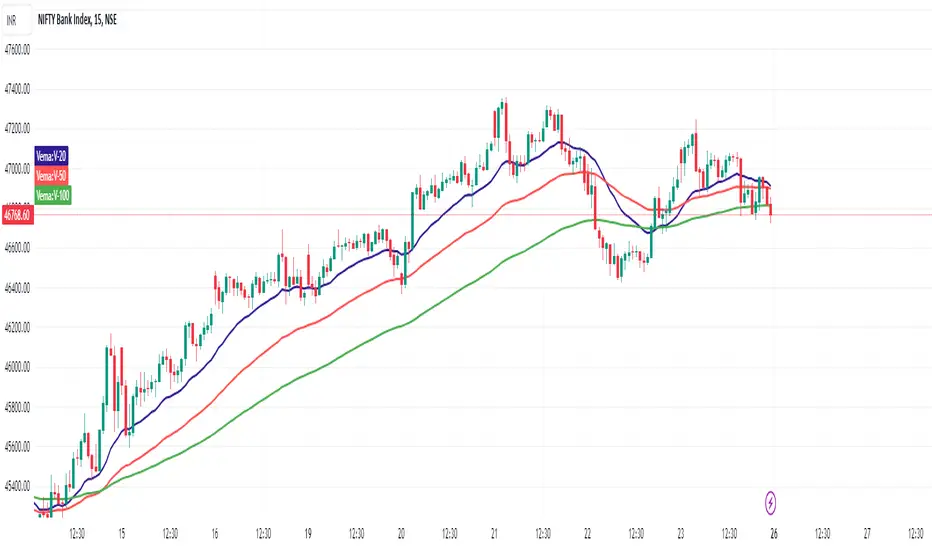
VEMA indicator is based on lower time frame volume data and it has 3 lines.
20, 50, 100 moving averages of the close price in each candle with the highest volume.
Effectively working fine and hence sharing.
Will Add more information with examples in next update
20, 50, 100 moving averages of the close price in each candle with the highest volume.
Effectively working fine and hence sharing.
Will Add more information with examples in next update
릴리즈 노트
The script changed from a default 10-second time frame to 1-minute time frame. In case our subscription to TV supports sec based time frame - please set it to 10 sec.
In general observation on any time frame:
If the price crosses all three lines and closes above or below 20-VEMA, we can see good movement in the same direction in short period of time.
Analyze more charts with different time frames along with your favorite indicator and VEMA lines.
릴리즈 노트
Minor correction as per coding guidelines오픈 소스 스크립트
트레이딩뷰의 진정한 정신에 따라, 이 스크립트의 작성자는 이를 오픈소스로 공개하여 트레이더들이 기능을 검토하고 검증할 수 있도록 했습니다. 작성자에게 찬사를 보냅니다! 이 코드는 무료로 사용할 수 있지만, 코드를 재게시하는 경우 하우스 룰이 적용된다는 점을 기억하세요.
면책사항
해당 정보와 게시물은 금융, 투자, 트레이딩 또는 기타 유형의 조언이나 권장 사항으로 간주되지 않으며, 트레이딩뷰에서 제공하거나 보증하는 것이 아닙니다. 자세한 내용은 이용 약관을 참조하세요.
오픈 소스 스크립트
트레이딩뷰의 진정한 정신에 따라, 이 스크립트의 작성자는 이를 오픈소스로 공개하여 트레이더들이 기능을 검토하고 검증할 수 있도록 했습니다. 작성자에게 찬사를 보냅니다! 이 코드는 무료로 사용할 수 있지만, 코드를 재게시하는 경우 하우스 룰이 적용된다는 점을 기억하세요.
면책사항
해당 정보와 게시물은 금융, 투자, 트레이딩 또는 기타 유형의 조언이나 권장 사항으로 간주되지 않으며, 트레이딩뷰에서 제공하거나 보증하는 것이 아닙니다. 자세한 내용은 이용 약관을 참조하세요.