OPEN-SOURCE SCRIPT
업데이트됨 Institutions vs. Crypto Whales Spot Buying

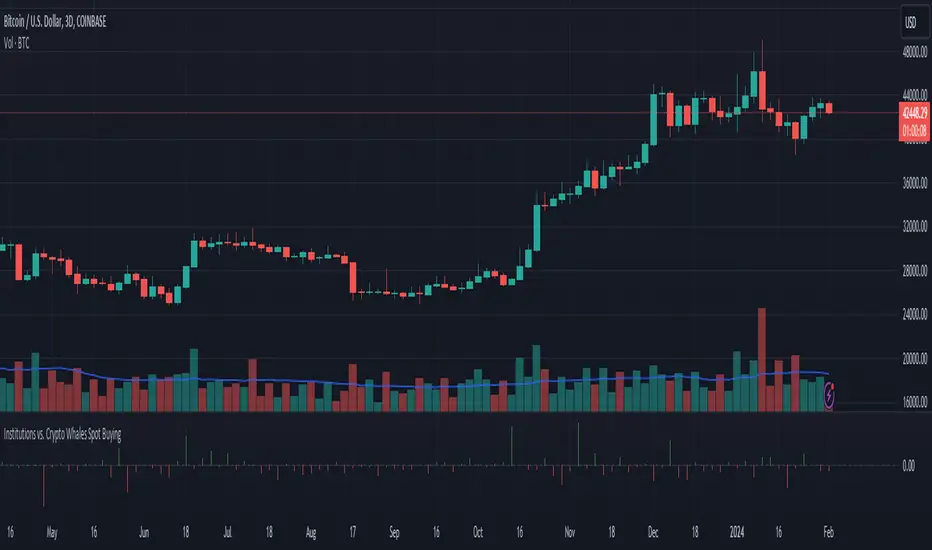
Based on analysis from tedtalksmacro, I have put together a similar tool that helps to visualise whether institutions (Coinbase and Deribit) or native crypto whales (Binance and Bitfinex) are leading the BTC spot buying.
This is plotted as the normalised relative difference (-1 and 1) between the average of Coinbase and Deribit spot price versus Binance and Bitfinex. If positive (i.e. green bar), institutions are trading at a premium; if negative (i.e. red bar), crypto whales are trading at a premium.
For example, if crypto whales are trading at a premium and price is increasing, then they are leading the buying relative to institutions. However, if whales are trading at a premium and price is decreasing, then it is likely institutions are selling off at a more rapid rate relative to the crypto whales buying pressure. This applies to the alternate scenario where institutions are trading at a premium to crypto whales.
In recent times, native crypto whales (largely Binance) drove the push from 40 to 48k, but then also marked the local top with a major sell off at this price. Institutions then took over buying at the most recent lows, driven largely by GBTC outflows slowing down and Blackrock daily inflows exceeding Grayscale outflows for the first time late last week.
릴리즈 노트
Minor cosmetic updates to script오픈 소스 스크립트
트레이딩뷰의 진정한 정신에 따라, 이 스크립트의 작성자는 이를 오픈소스로 공개하여 트레이더들이 기능을 검토하고 검증할 수 있도록 했습니다. 작성자에게 찬사를 보냅니다! 이 코드는 무료로 사용할 수 있지만, 코드를 재게시하는 경우 하우스 룰이 적용된다는 점을 기억하세요.
면책사항
해당 정보와 게시물은 금융, 투자, 트레이딩 또는 기타 유형의 조언이나 권장 사항으로 간주되지 않으며, 트레이딩뷰에서 제공하거나 보증하는 것이 아닙니다. 자세한 내용은 이용 약관을 참조하세요.
오픈 소스 스크립트
트레이딩뷰의 진정한 정신에 따라, 이 스크립트의 작성자는 이를 오픈소스로 공개하여 트레이더들이 기능을 검토하고 검증할 수 있도록 했습니다. 작성자에게 찬사를 보냅니다! 이 코드는 무료로 사용할 수 있지만, 코드를 재게시하는 경우 하우스 룰이 적용된다는 점을 기억하세요.
면책사항
해당 정보와 게시물은 금융, 투자, 트레이딩 또는 기타 유형의 조언이나 권장 사항으로 간주되지 않으며, 트레이딩뷰에서 제공하거나 보증하는 것이 아닙니다. 자세한 내용은 이용 약관을 참조하세요.