OPEN-SOURCE SCRIPT
업데이트됨 Niteya BG Candle Formations

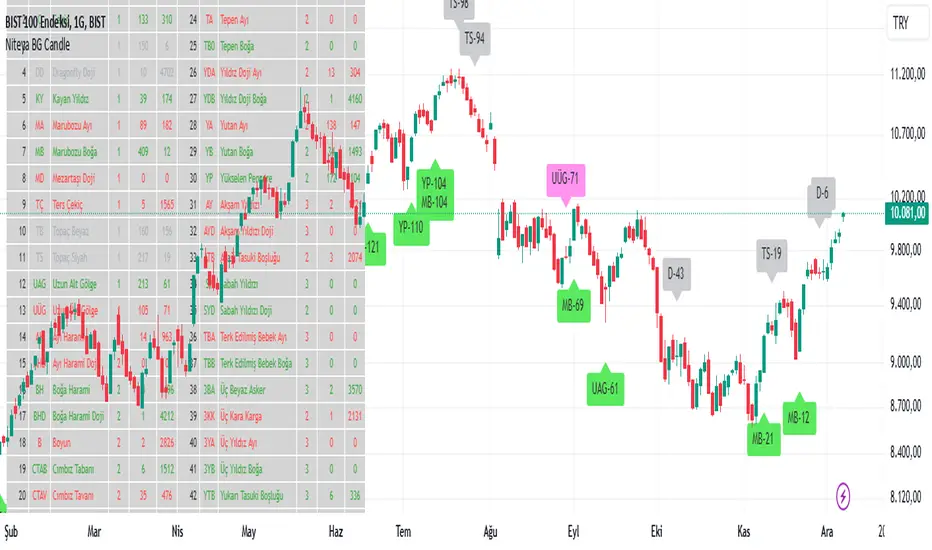
Niteya BG Candle Formations is an indicator that shows the total number of formations of each of the 44 different candlestick formations and the index of the last bar it was formed in a table and on a chart.
It shows candlestick formations that express uptrends and downtrends and indecisive market conditions in different colors.
The table columns contain the values shown below:
S.No: Candlestick formation bar index number
Code: Candlestick formation abbreviation
Formation: Name of the candlestick formation
Quantity: Number of candles in the formation
Total: Total number of formations on the chart
Last: Index of the last formation on the chart
bilgigunlugum.net/public/images/borsa/candlef_1.png
Details
bilgigunlugum.net/borsa/pine_script/pine_script_indicator/candlef
Türkçe açıklaması
Niteya BG Candle Formations, toplam 44 adet farklı mum formasyonunun her birinin toplam oluşma sayısını ve en son oluştuğu barın endeksini bir tabloda ve grafik üzerinde gösteren bir indikatördür.
Yükseliş ve düşüş trendleri ile kararsız piyasa durumlarını ifade eden mum formasyonlarını farklı renkte gösterir.
Tablo sütunları aşağıda gösterilen değerleri içerir:
S.No: Mum formasyonu sıra numarası
Kod: Mum formasyonu kısaltması
Formasyonu: Mum formasyonunun adı
Adet: Formasyonu oluşturan mum sayısı
Toplam: Grafikte gerçekleşen toplam formasyon sayısı
Son: Grafikte gerçekleşen en son formasyon endeksi
bilgigunlugum.net/public/images/borsa/candlef_1.png
Detaylar
bilgigunlugum.net/borsa/pine_script/pine_script_indicator/candlef
릴리즈 노트
Table and character sizes have been reduced.오픈 소스 스크립트
트레이딩뷰의 진정한 정신에 따라, 이 스크립트의 작성자는 이를 오픈소스로 공개하여 트레이더들이 기능을 검토하고 검증할 수 있도록 했습니다. 작성자에게 찬사를 보냅니다! 이 코드는 무료로 사용할 수 있지만, 코드를 재게시하는 경우 하우스 룰이 적용된다는 점을 기억하세요.
면책사항
해당 정보와 게시물은 금융, 투자, 트레이딩 또는 기타 유형의 조언이나 권장 사항으로 간주되지 않으며, 트레이딩뷰에서 제공하거나 보증하는 것이 아닙니다. 자세한 내용은 이용 약관을 참조하세요.
오픈 소스 스크립트
트레이딩뷰의 진정한 정신에 따라, 이 스크립트의 작성자는 이를 오픈소스로 공개하여 트레이더들이 기능을 검토하고 검증할 수 있도록 했습니다. 작성자에게 찬사를 보냅니다! 이 코드는 무료로 사용할 수 있지만, 코드를 재게시하는 경우 하우스 룰이 적용된다는 점을 기억하세요.
면책사항
해당 정보와 게시물은 금융, 투자, 트레이딩 또는 기타 유형의 조언이나 권장 사항으로 간주되지 않으며, 트레이딩뷰에서 제공하거나 보증하는 것이 아닙니다. 자세한 내용은 이용 약관을 참조하세요.