OPEN-SOURCE SCRIPT
업데이트됨 Day Range EU/Rome 00:00-22:30 - live + storico (colori)
# Day Range EU/Rome 00:00–22:30 — live + historical (colors)
**What it does**
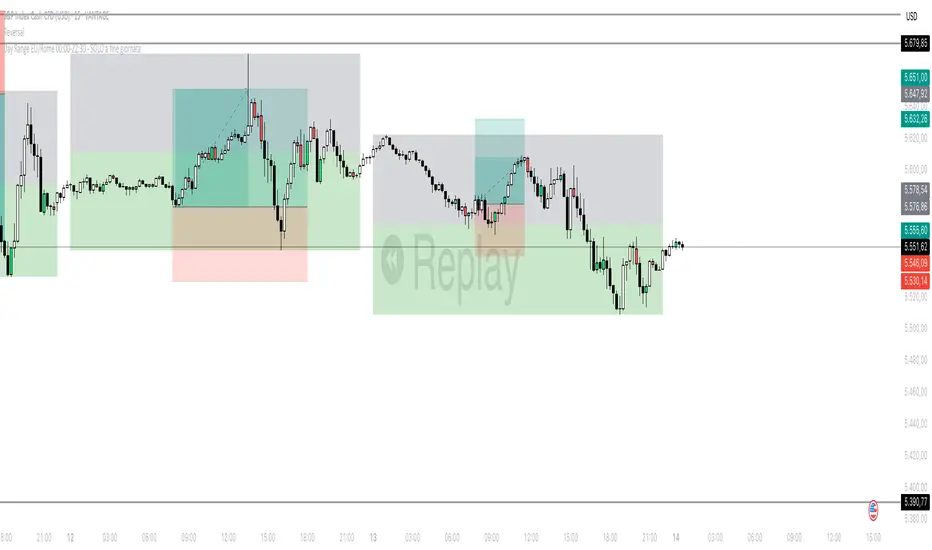
Draws, for each day (timezone **Europe/Rome**), a rectangle that contains the **high** and **low** recorded between **00:00** and **22:30**.
* During the day it creates a **live box** that updates bar by bar (it extends to the latest candle).
* At the end of the session (after 22:30) it saves a **fixed historical box** for that day.
* The rectangle is **split horizontally**: half **top** and half **bottom** (customizable colors).
* Boxes are **anchored in time** (*xloc = bar\_time*): they don’t “slide” when you zoom or pan the chart.
* Works on **intraday** timeframes (recommended **15m**; also fine on 5m, 30m, 1h).
* Includes **all days**, **Friday included**.
---
## How it works
* The code detects the **00:00 → 22:30 (Europe/Rome)** session with `time("0000-2230","Europe/Rome")`.
* Within that window it continuously updates the day’s **High/Low**.
* When the **session closes** it creates two historical boxes (upper and lower halves) using the **H/L** of the day that just ended.
* The current day’s box remains **live** and follows the chart until 22:30.
**What it does**
Draws, for each day (timezone **Europe/Rome**), a rectangle that contains the **high** and **low** recorded between **00:00** and **22:30**.
* During the day it creates a **live box** that updates bar by bar (it extends to the latest candle).
* At the end of the session (after 22:30) it saves a **fixed historical box** for that day.
* The rectangle is **split horizontally**: half **top** and half **bottom** (customizable colors).
* Boxes are **anchored in time** (*xloc = bar\_time*): they don’t “slide” when you zoom or pan the chart.
* Works on **intraday** timeframes (recommended **15m**; also fine on 5m, 30m, 1h).
* Includes **all days**, **Friday included**.
---
## How it works
* The code detects the **00:00 → 22:30 (Europe/Rome)** session with `time("0000-2230","Europe/Rome")`.
* Within that window it continuously updates the day’s **High/Low**.
* When the **session closes** it creates two historical boxes (upper and lower halves) using the **H/L** of the day that just ended.
* The current day’s box remains **live** and follows the chart until 22:30.
릴리즈 노트
# Day Range EU/Rome 00:00–22:30 — live + historical (colors)**What it does**
Draws, for each day (timezone **Europe/Rome**), a rectangle that contains the **high** and **low** recorded between **00:00** and **22:30**.
* During the day it creates a **live box** that updates bar by bar (it extends to the latest candle).
* At the end of the session (after 22:30) it saves a **fixed historical box** for that day.
* The rectangle is **split horizontally**: half **top** and half **bottom** (customizable colors).
* Boxes are **anchored in time** (*xloc = bar\_time*): they don’t “slide” when you zoom or pan the chart.
* Works on **intraday** timeframes (recommended **15m**; also fine on 5m, 30m, 1h).
* Includes **all days**, **Friday included**.
---
## How it works
* The code detects the **00:00 → 22:30 (Europe/Rome)** session with `time("0000-2230","Europe/Rome")`.
* Within that window it continuously updates the day’s **High/Low**.
* When the **session closes** it creates two historical boxes (upper and lower halves) using the **H/L** of the day that just ended.
* The current day’s box remains **live** and follows the chart until 22:30.
오픈 소스 스크립트
트레이딩뷰의 진정한 정신에 따라, 이 스크립트의 작성자는 이를 오픈소스로 공개하여 트레이더들이 기능을 검토하고 검증할 수 있도록 했습니다. 작성자에게 찬사를 보냅니다! 이 코드는 무료로 사용할 수 있지만, 코드를 재게시하는 경우 하우스 룰이 적용된다는 점을 기억하세요.
면책사항
해당 정보와 게시물은 금융, 투자, 트레이딩 또는 기타 유형의 조언이나 권장 사항으로 간주되지 않으며, 트레이딩뷰에서 제공하거나 보증하는 것이 아닙니다. 자세한 내용은 이용 약관을 참조하세요.
오픈 소스 스크립트
트레이딩뷰의 진정한 정신에 따라, 이 스크립트의 작성자는 이를 오픈소스로 공개하여 트레이더들이 기능을 검토하고 검증할 수 있도록 했습니다. 작성자에게 찬사를 보냅니다! 이 코드는 무료로 사용할 수 있지만, 코드를 재게시하는 경우 하우스 룰이 적용된다는 점을 기억하세요.
면책사항
해당 정보와 게시물은 금융, 투자, 트레이딩 또는 기타 유형의 조언이나 권장 사항으로 간주되지 않으며, 트레이딩뷰에서 제공하거나 보증하는 것이 아닙니다. 자세한 내용은 이용 약관을 참조하세요.