OPEN-SOURCE SCRIPT
expected range STUDY
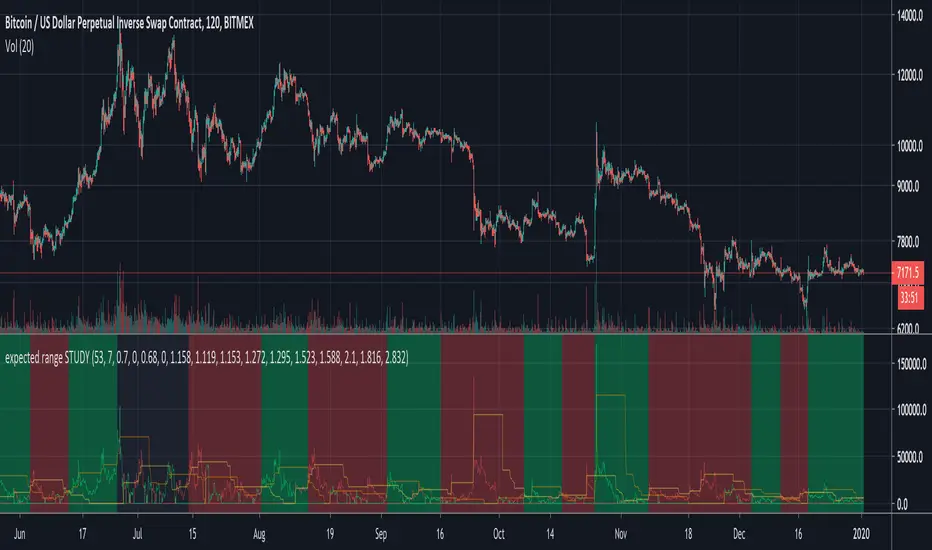
This is an indicator that measures how much price movement (low to high) we've seen in a set of 1 bar back, 2 bars back, 3 bars back, 5 bars back, 8 bars back using the Fibonacci sequence up to 89 bars back, and then measures how low or high within each range we are, sort of like giving a rating of 0 for sitting on the lower Bollinger Band and a rating of 100 for sitting on the higher Bollinger band. It combines all the data and weights the data by the historical strength of signal from each length of bands. It's been tuned to a 2 hour XBTUSD chart, but it could be used on other things and other timeframes too. Some tweaking would be needed, though. The final result works more like a trend following indictor than and indicator that tries to pick an exact trend reversal point. However, you're free to use it how you want. Frequently you get a nice red or green spike up showing you when the bottom or top is in, but sometimes those spikes are just the start of an extended down move or up move.
On the chart, a buy (long) signal is generated when the green line crosses up above the orange line. To make it extra clear the background is green when you should be long. A sell (short) signal is generated with the red line crosses up above the yellow line. The background will be red when you should be short. If the background is black, it's indicating a profit of over 53% was taken and it's waiting for another trade to start. Up to you to take profit or keep riding your trade.
For XBTUSD trades, a full take profit on any trade exceeding 53% gains works nice (on 1x leverage) and a stoploss of -7% works quite nicely too. One could use this on up to 2x leverage but I wouldn't recommend going much higher. Have fun. Trade carefully. Don't get rekt.
I will release the "expected range STRATEGY" to go along with this so you can do your own backtesting.
Disclaimer: I haven't tested the alerts, but they should work. Use at your own risk.
오픈 소스 스크립트
트레이딩뷰의 진정한 정신에 따라, 이 스크립트의 작성자는 이를 오픈소스로 공개하여 트레이더들이 기능을 검토하고 검증할 수 있도록 했습니다. 작성자에게 찬사를 보냅니다! 이 코드는 무료로 사용할 수 있지만, 코드를 재게시하는 경우 하우스 룰이 적용된다는 점을 기억하세요.
면책사항
해당 정보와 게시물은 금융, 투자, 트레이딩 또는 기타 유형의 조언이나 권장 사항으로 간주되지 않으며, 트레이딩뷰에서 제공하거나 보증하는 것이 아닙니다. 자세한 내용은 이용 약관을 참조하세요.
오픈 소스 스크립트
트레이딩뷰의 진정한 정신에 따라, 이 스크립트의 작성자는 이를 오픈소스로 공개하여 트레이더들이 기능을 검토하고 검증할 수 있도록 했습니다. 작성자에게 찬사를 보냅니다! 이 코드는 무료로 사용할 수 있지만, 코드를 재게시하는 경우 하우스 룰이 적용된다는 점을 기억하세요.
면책사항
해당 정보와 게시물은 금융, 투자, 트레이딩 또는 기타 유형의 조언이나 권장 사항으로 간주되지 않으며, 트레이딩뷰에서 제공하거나 보증하는 것이 아닙니다. 자세한 내용은 이용 약관을 참조하세요.