PROTECTED SOURCE SCRIPT
Px & Vol Up/Dn Ratio with MA
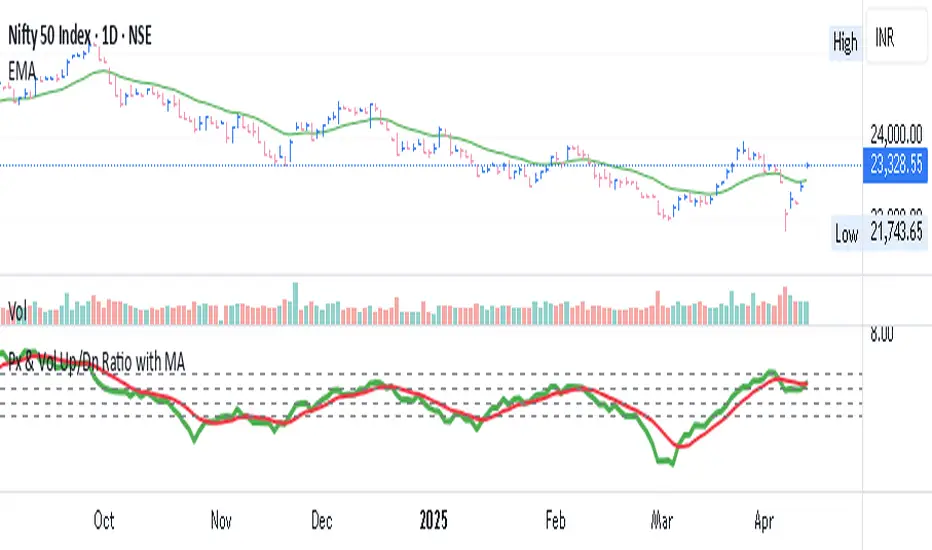
Px & Vol Up/Down Ratio with Moving Average
This custom indicator calculates the Price Up/Down Ratio and Volume Up/Down Ratio over a user-defined lookback period. It provides a unique perspective on market strength by comparing the magnitude of gains vs. losses (in both price and volume) — helping traders gauge the underlying momentum and accumulation/distribution behavior.
🔍 Core Features:
Price Ratio: Total positive price change divided by the absolute value of total negative price change.
Volume Ratio: Total volume on up days divided by total volume on down days.
Moving Average Overlay: Smooth each ratio with your choice of moving average — SMA, EMA, or WMA.
Customizable lookback period and moving average length for flexible analysis.
🧭 Use Case:
A rising Price Ratio above 1 indicates stronger positive price action than negative.
A rising Volume Ratio above 1 suggests increased participation on up moves — a sign of accumulation.
Divergences between Price and Volume ratios can provide early clues on trend reversals or weakening momentum.
🧱 Visual Aids:
Includes six key horizontal reference lines at levels: 0.5, 0.75, 1, 1.25, 1.5, 2 to benchmark current ratio strength.
Color-coded plots for clarity:
Blue for Price Ratio
Green for Volume Ratio
보호된 스크립트입니다
이 스크립트는 비공개 소스로 게시됩니다. 하지만 이를 자유롭게 제한 없이 사용할 수 있습니다 – 자세한 내용은 여기에서 확인하세요.
면책사항
해당 정보와 게시물은 금융, 투자, 트레이딩 또는 기타 유형의 조언이나 권장 사항으로 간주되지 않으며, 트레이딩뷰에서 제공하거나 보증하는 것이 아닙니다. 자세한 내용은 이용 약관을 참조하세요.
보호된 스크립트입니다
이 스크립트는 비공개 소스로 게시됩니다. 하지만 이를 자유롭게 제한 없이 사용할 수 있습니다 – 자세한 내용은 여기에서 확인하세요.
면책사항
해당 정보와 게시물은 금융, 투자, 트레이딩 또는 기타 유형의 조언이나 권장 사항으로 간주되지 않으며, 트레이딩뷰에서 제공하거나 보증하는 것이 아닙니다. 자세한 내용은 이용 약관을 참조하세요.