OPEN-SOURCE SCRIPT
업데이트됨 Ribbon — multi-MA trend bands
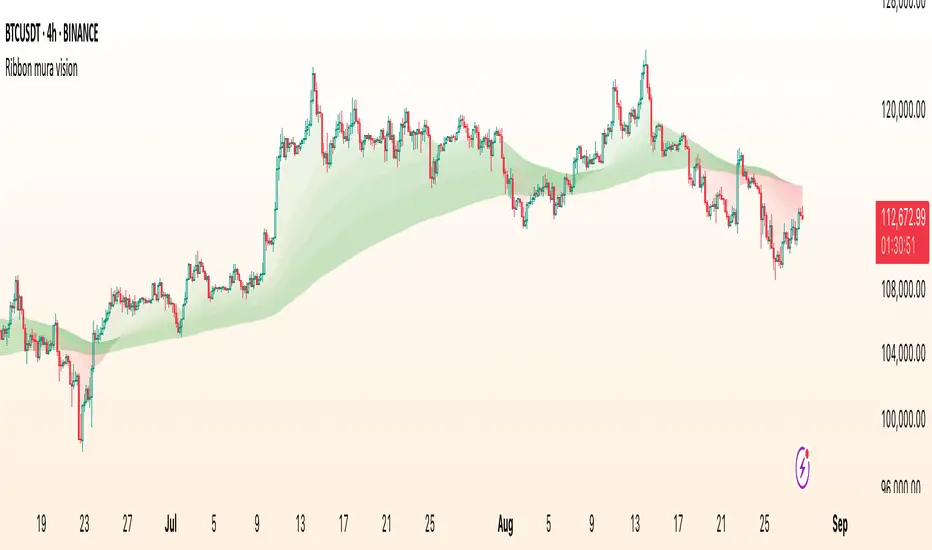
Ribbon paints five translucent bands between six moving averages to visualize trend structure and regime at a glance. You can choose the MA type (EMA/SMA/WMA), customize lengths, and switch the coloring logic between an anchor-based mode and strict alignment.
What it shows
Coloring modes
1. By EMA233 (Anchor mode)
Each band is colored Up or Down by comparing its upper MA to the anchor (the 6th MA in inputs, default length 233).
2. By Alignment
Inputs (key)
How to read it
Implementation notes
Disclaimer
This script is for educational and informational purposes only and does not constitute financial advice. Always test on historical data and manage risk appropriately.
What it shows
- Six MAs on the current timeframe (defaults: 5 / 34 / 55 / 89 / 144 / 233).
- Five bands filled between consecutive MAs:
- 5–34, 34–55, 55–89, 89–144, 144–233.
- Optional plotting of MA lines (hidden by default to keep the chart clean).
Coloring modes
1. By EMA233 (Anchor mode)
Each band is colored Up or Down by comparing its upper MA to the anchor (the 6th MA in inputs, default length 233).
- If MA > anchor → Up color (supportive regime).
- If MA < anchor → Down color (resistive regime).
2. By Alignment
- All bands share one color depending on strict ordering:
- Up if MA1 > MA2 > MA3 > MA4 > MA5 > MA6
- Down if MA1 < MA2 < MA3 < MA4 < MA5 < MA6
- Gray otherwise (no clean alignment).
Inputs (key)
- MA Type: EMA / SMA / WMA (applies to all six MAs).
- MA 1…MA 6 (anchor): lengths for each average (defaults form a classic ribbon up to 233).
- Up/Down colors: band palette.
- Base transparency / step: controls band opacity gradient (top band uses Base, each next band adds Step).
- Show MA lines + Lines transparency: optionally draw the six MA curves.
How to read it
- Directional bias: when most bands are green (anchor mode) or the whole ribbon is green (alignment mode), momentum favors the upside; red implies downside pressure.
- Quality of trend: a persistent alignment (all ordered) signals a cleaner trend. Mixed/gray suggests chop or transition.
- Pullback zones: price returning toward inner bands can mark areas to watch for continuation vs. failure.
Implementation notes
- No higher-timeframe data, no lookahead — this is a non-repainting, current-TF visualization.
- Bands still render even when MA lines are hidden (the script uses hidden plot anchors under the hood).
- This is an indicator, not a strategy — it does not open/close trades or calculate P&L.
Disclaimer
This script is for educational and informational purposes only and does not constitute financial advice. Always test on historical data and manage risk appropriately.
릴리즈 노트
Minor update오픈 소스 스크립트
트레이딩뷰의 진정한 정신에 따라, 이 스크립트의 작성자는 이를 오픈소스로 공개하여 트레이더들이 기능을 검토하고 검증할 수 있도록 했습니다. 작성자에게 찬사를 보냅니다! 이 코드는 무료로 사용할 수 있지만, 코드를 재게시하는 경우 하우스 룰이 적용된다는 점을 기억하세요.
✅My Telegram
t.me/charyyevn
t.me/charyyevn
면책사항
해당 정보와 게시물은 금융, 투자, 트레이딩 또는 기타 유형의 조언이나 권장 사항으로 간주되지 않으며, 트레이딩뷰에서 제공하거나 보증하는 것이 아닙니다. 자세한 내용은 이용 약관을 참조하세요.
오픈 소스 스크립트
트레이딩뷰의 진정한 정신에 따라, 이 스크립트의 작성자는 이를 오픈소스로 공개하여 트레이더들이 기능을 검토하고 검증할 수 있도록 했습니다. 작성자에게 찬사를 보냅니다! 이 코드는 무료로 사용할 수 있지만, 코드를 재게시하는 경우 하우스 룰이 적용된다는 점을 기억하세요.
✅My Telegram
t.me/charyyevn
t.me/charyyevn
면책사항
해당 정보와 게시물은 금융, 투자, 트레이딩 또는 기타 유형의 조언이나 권장 사항으로 간주되지 않으며, 트레이딩뷰에서 제공하거나 보증하는 것이 아닙니다. 자세한 내용은 이용 약관을 참조하세요.