INVITE-ONLY SCRIPT
업데이트됨 Relative Trend Navigator Pro [QuantAlgo]
Upgrade your trend-following investing and trading strategy with Relative Trend Navigator Pro by QuantAlgo, a sophisticated technical indicator that combines adaptive trend recognition with dynamic momentum analysis to deliver high quality market insights. Whether you're a medium- to long-term investor focusing on sustained moves or an active trader seeking high-probability entries, this indicator's multi-layered approach offers valuable strategic advantages that you don't want to miss out on!
🟢 Core Architecture
The foundation of this indicator lies in its innovative Relative Trend Index (RTI) calculation and dynamic state management system. By implementing a unique array-based analysis alongside statistical volatility measures, each price movement is evaluated against its historical context while maintaining responsiveness to current market conditions. This sophisticated approach helps distinguish genuine trend developments from market noise across various timeframes and instruments.

🟢 Technical Foundation
Three key components power this indicator are:

🟢 Key Features & Signals
The Relative Trend Navigator Pro delivers market insights through:

🟢 Practical Usage Tips
Here's how to maximize your use of the Relative Trend Navigator Pro:
1/ Setup:
2/ Reading Signals:
🟢 Pro Tips
🟢 Core Architecture
The foundation of this indicator lies in its innovative Relative Trend Index (RTI) calculation and dynamic state management system. By implementing a unique array-based analysis alongside statistical volatility measures, each price movement is evaluated against its historical context while maintaining responsiveness to current market conditions. This sophisticated approach helps distinguish genuine trend developments from market noise across various timeframes and instruments.
🟢 Technical Foundation
Three key components power this indicator are:
- Dynamic Trend Boundaries: Utilizes standard deviation-based channels to establish adaptive price ranges
- Array-Based Historical Analysis: A comprehensive dynamic momentum system that processes and sorts historical data for trend context
- Relative Trend Index (RTI): A normalized calculation that measures current price position relative to historical boundaries
🟢 Key Features & Signals
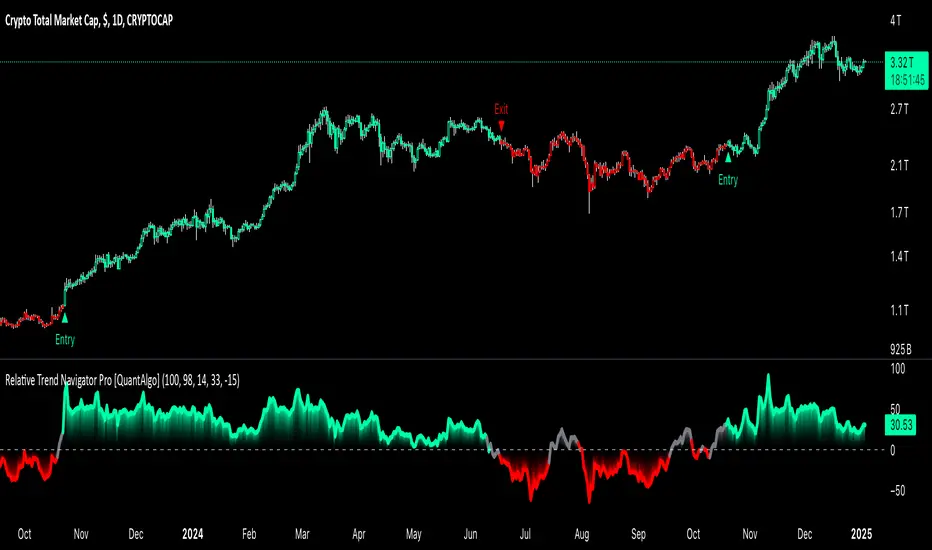
The Relative Trend Navigator Pro delivers market insights through:
- Color-adaptive RTI line that reflects trend strength and direction
- Dynamic threshold levels for bull and bear signal generation
- Smart fill coloring between RTI and zero line for enhanced visualization
- Clear entry and exit markers for validated trend changes
- Intelligent bar coloring that highlights current trend state
- Customizable alert system for both bullish and bearish setups
🟢 Practical Usage Tips
Here's how to maximize your use of the Relative Trend Navigator Pro:
1/ Setup:
- Add the indicator to your favorites ⭐️
- Begin with the default historical lookback for balanced analysis
- Use the default sensitivity setting for optimal signal generation
- Start with standard threshold levels
- Customize visualization colors to match your chart preferences
- Enable both bar coloring and signal markers for complete visual feedback
2/ Reading Signals:
- Watch for signal markers - they indicate validated trend transitions
- Monitor RTI line color changes for trend direction confirmation
- Observe the fill color between RTI and zero line for trend strength
- Use the built-in alert system to stay informed of potential trend changes
🟢 Pro Tips
- Adjust Historical Lookback Period based on your preferred timeframe:
→ Lower values (20-50) for more responsive signals
→ Higher values (100-200) for more stable trend identification
- Fine-tune Sensitivity based on market conditions:
→ Higher values (95-100) for choppy markets
→ Lower values (85-95) for trending markets
- Optimize Threshold Levels for your strategy:
→ Increase thresholds for stronger trend confirmation
→ Decrease thresholds for earlier entries
- Combine with:
→ Volume analysis for trade confirmation
→ Multiple timeframe analysis for strategic context
→ Support/resistance levels for entry/exit refinement
릴리즈 노트
Updated alerts.릴리즈 노트
Updated alerts.초대 전용 스크립트
이 스크립트는 작성자가 승인한 사용자만 접근할 수 있습니다. 사용하려면 요청 후 승인을 받아야 하며, 일반적으로 결제 후에 허가가 부여됩니다. 자세한 내용은 아래 작성자의 안내를 따르거나 QuantAlgo에게 직접 문의하세요.
트레이딩뷰는 스크립트의 작동 방식을 충분히 이해하고 작성자를 완전히 신뢰하지 않는 이상, 해당 스크립트에 비용을 지불하거나 사용하는 것을 권장하지 않습니다. 커뮤니티 스크립트에서 무료 오픈소스 대안을 찾아보실 수도 있습니다.
작성자 지시 사항
Available as part of our Premium package (3-day FREE trial) here: https://whop.com/quantalgo/
👉 Access our best trading & investing tools here (3-day FREE trial): whop.com/quantalgo/
면책사항
해당 정보와 게시물은 금융, 투자, 트레이딩 또는 기타 유형의 조언이나 권장 사항으로 간주되지 않으며, 트레이딩뷰에서 제공하거나 보증하는 것이 아닙니다. 자세한 내용은 이용 약관을 참조하세요.
초대 전용 스크립트
이 스크립트는 작성자가 승인한 사용자만 접근할 수 있습니다. 사용하려면 요청 후 승인을 받아야 하며, 일반적으로 결제 후에 허가가 부여됩니다. 자세한 내용은 아래 작성자의 안내를 따르거나 QuantAlgo에게 직접 문의하세요.
트레이딩뷰는 스크립트의 작동 방식을 충분히 이해하고 작성자를 완전히 신뢰하지 않는 이상, 해당 스크립트에 비용을 지불하거나 사용하는 것을 권장하지 않습니다. 커뮤니티 스크립트에서 무료 오픈소스 대안을 찾아보실 수도 있습니다.
작성자 지시 사항
Available as part of our Premium package (3-day FREE trial) here: https://whop.com/quantalgo/
👉 Access our best trading & investing tools here (3-day FREE trial): whop.com/quantalgo/
면책사항
해당 정보와 게시물은 금융, 투자, 트레이딩 또는 기타 유형의 조언이나 권장 사항으로 간주되지 않으며, 트레이딩뷰에서 제공하거나 보증하는 것이 아닙니다. 자세한 내용은 이용 약관을 참조하세요.