OPEN-SOURCE SCRIPT
Bitcoin Power Law Oscillator [InvestorUnknown]
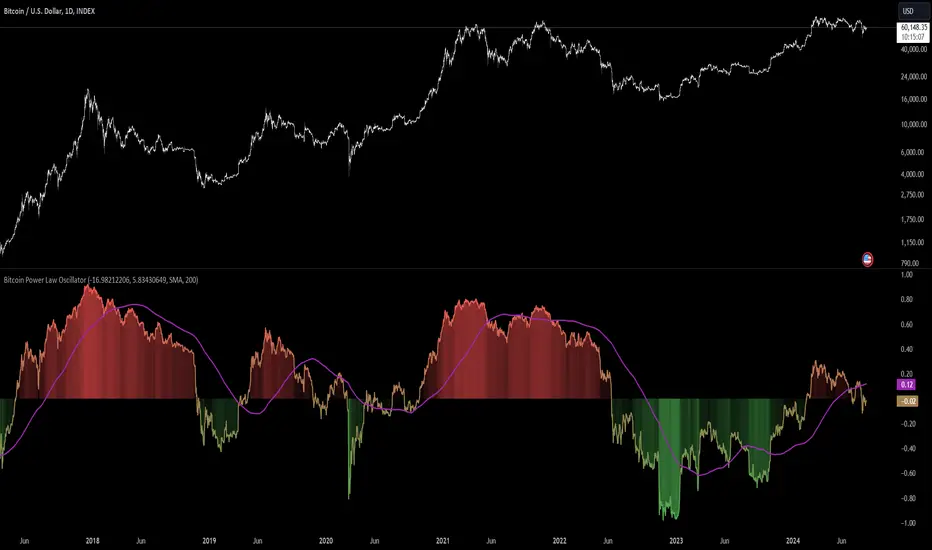
The Bitcoin Power Law Oscillator is a specialized tool designed for long-term mean-reversion analysis of Bitcoin's price relative to a theoretical midline derived from the Bitcoin Power Law model (made by capriole_charles). This oscillator helps investors identify whether Bitcoin is currently overbought, oversold, or near its fair value according to this mathematical model.

Key Features:
Pine Script®
Pine Script®
This indicator is particularly useful for long-term Bitcoin investors who wish to gauge the market's mean-reversion tendencies based on a well-established theoretical model. By focusing on the Power Law’s midline, users can gain insights into whether Bitcoin’s current price deviates significantly from what historical trends would suggest as a fair value.
Key Features:
- Power Law Model Integration: The oscillator is based on the midline of the Bitcoin Power Law, which is calculated using regression coefficients (A and B) applied to the logarithm of the number of days since Bitcoin’s inception. This midline represents a theoretical fair value for Bitcoin over time.
- Midline Distance Calculation: The distance between Bitcoin’s current price and the Power Law midline is computed as a percentage, indicating how far above or below the price is from this theoretical value.
float a = input.float (-16.98212206, 'Regression Coef. A', group = "Power Law Settings")
float b = input.float (5.83430649, 'Regression Coef. B', group = "Power Law Settings")
normalization_start_date = timestamp(2011,1,1)
calculation_start_date = time == timestamp(2010, 7, 19, 0, 0) // First BLX Bitcoin Date
int days_since = request.security('BNC:BLX', 'D', ta.barssince(calculation_start_date))
bar() =>
[open, high, low, close]
[btc_open, btc_high, btc_low, btc_close] = request.security('BNC:BLX', 'D', bar())
int offset = 564 // days between 2009/1/1 and "calculation_start_date"
int days = days_since + offset
float e = a + b * math.log10(days)
float y = math.pow(10, e)
float midline_distance = math.round((y / btc_close - 1.0) * 100)
- Oscillator Normalization: The raw distance is converted into a normalized oscillator, which fluctuates between -1 and 1. This normalization adjusts the oscillator to account for historical extremes, making it easier to compare current conditions with past market behavior.
float oscillator = -midline_distance
var float min = na
var float max = na
if (oscillator > max or na(max)) and time >= normalization_start_date
max := oscillator
if (min > oscillator or na(min)) and time >= normalization_start_date
min := oscillator
rescale(float value, float min, float max) =>
(2 * (value - min) / (max - min)) - 1
normalized_oscillator = rescale(oscillator, min, max)
- Overbought/Oversold Identification: The oscillator provides a clear visual representation, where values near 1 suggest Bitcoin is overbought, and values near -1 indicate it is oversold. This can help identify potential reversal points or areas of significant market imbalance.
- Optional Moving Average: Users can overlay a moving average (either SMA or EMA) on the oscillator to smooth out short-term fluctuations and focus on longer-term trends. This is particularly useful for confirming trend reversals or persistent overbought/oversold conditions.
This indicator is particularly useful for long-term Bitcoin investors who wish to gauge the market's mean-reversion tendencies based on a well-established theoretical model. By focusing on the Power Law’s midline, users can gain insights into whether Bitcoin’s current price deviates significantly from what historical trends would suggest as a fair value.
오픈 소스 스크립트
트레이딩뷰의 진정한 정신에 따라, 이 스크립트의 작성자는 이를 오픈소스로 공개하여 트레이더들이 기능을 검토하고 검증할 수 있도록 했습니다. 작성자에게 찬사를 보냅니다! 이 코드는 무료로 사용할 수 있지만, 코드를 재게시하는 경우 하우스 룰이 적용된다는 점을 기억하세요.
면책사항
해당 정보와 게시물은 금융, 투자, 트레이딩 또는 기타 유형의 조언이나 권장 사항으로 간주되지 않으며, 트레이딩뷰에서 제공하거나 보증하는 것이 아닙니다. 자세한 내용은 이용 약관을 참조하세요.
오픈 소스 스크립트
트레이딩뷰의 진정한 정신에 따라, 이 스크립트의 작성자는 이를 오픈소스로 공개하여 트레이더들이 기능을 검토하고 검증할 수 있도록 했습니다. 작성자에게 찬사를 보냅니다! 이 코드는 무료로 사용할 수 있지만, 코드를 재게시하는 경우 하우스 룰이 적용된다는 점을 기억하세요.
면책사항
해당 정보와 게시물은 금융, 투자, 트레이딩 또는 기타 유형의 조언이나 권장 사항으로 간주되지 않으며, 트레이딩뷰에서 제공하거나 보증하는 것이 아닙니다. 자세한 내용은 이용 약관을 참조하세요.