INVITE-ONLY SCRIPT
Pristine Adaptive Alpha Screener
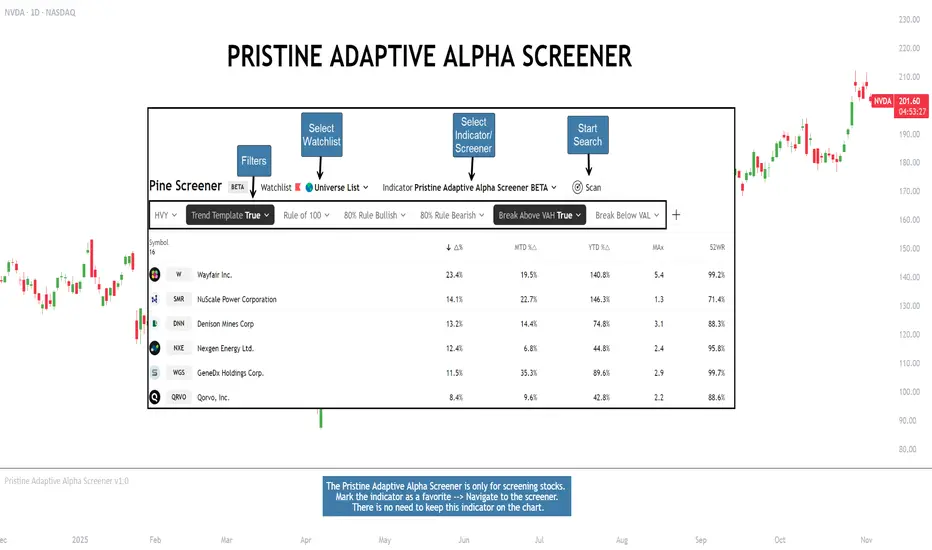
The Pristine Adaptive Alpha Screener allows users to screen for all of the trading signals embedded in our premium suite of TradingView tools🏆
▪ Pristine Value Areas & MGI
▪ Pristine Fundamental Analysis
▪ Pristine Volume Analysis
💠 Signals Overview
▪HVY(highest volume in a year)-> Featured in Pristine Volume Analysis
▪Trend Template -> Inspired by Mark Minervini's famous trend filters
▪Rule of 100 -> Metrics from Pristine Fundamental Analysis
▪Bullish 80% Rule -> Featured in Pristine Value Areas & MGI
▪Bearish 80% Rule -> Featured in Pristine Value Areas & MGI
▪Break Above VAH -> Featured in Pristine Value Areas & MGI
▪Break Below VAL -> Featured in Pristine Value Areas & MGI
💠 Signals Decoded
▪HVY(highest volume in a year)
Volume is an important metric to track when trading, because abnormally high volume tends to occur when a new trend is kicking off, or when an established trend is hitting a climax. Screen for HVY to quickly curate every stock that meets this condition

▪Trend Template
Mark Minervini's gift to the trading world. Via his book "Think and Trade Like a Stock Market Wizard". Filter for trend template stocks using our tool.

▪Rule of 100
Pristine Capital's gift to the trading world. The rule of 100 filters for stocks that meet the following condition: YoY EPS Growth + YoY Sales Growth >= 100%
▪Bullish 80% Rule
If a security opens a period below the value area low, and subsequently closes above it, the bullish 80% rule triggers, turning the value area green. One can trade for a move to the top of the value area, using a close below the value area low as a potential stop!
In the below example, HOOD triggered the bullish 80% rule after it reclaimed the monthly value area!

HOOD proceeded to rally through the monthly value area and beyond in subsequent trading sessions. Finding the first stocks to trigger the bullish 80% rule after a market correction is key for spotting the next market leaders!

▪Bearish 80% Rule
If a security opens a period above the value area high, and subsequently closes below it, the bearish 80% rule triggers, turning the value area red. One can trade for a move to the bottom of the value area, using a close above the value area high as a potential stop!

ES proceeded to follow through and test the value area low before trending below the weekly value area

▪Break Above VAH
When a security is inside value, the auction is in balance. When it breaks above a value area, it could be entering a period of upward price discovery. One can trade these breakouts with tight risk control by setting a stop inside the value area! These breakouts can be traded on all chart timeframes depending on the style of the individual trader. Combining multiple timeframes can result in even more effective trading setups.
RBLX broke out from the monthly value area on 4/22/25👇

RBLX proceeded to rally +62.78% in 39 trading sessions following the monthly VAH breakout!

▪Break Below VAL
When a security is inside value, the auction is in balance. When it breaks below a value area, it could be entering a period of downward price discovery. One can trade these breakdowns with tight risk control by setting a stop inside the value area! These breakouts can be traded on all chart timeframes depending on the style of the individual trader. Combining multiple timeframes can result in even more effective trading setups.
CHWY broke below the monthly value area on 7/20/23👇

CHWY proceeded to decline -53.11% in the following 64 trading sessions following the monthly VAL breakdown!

💠 Metric Columns
▪%𝚫 - 1-day percent change in price
▪YTD %𝚫 - Year-to-date percent change in price
▪MTD %𝚫 - Month-to-date percent change in price
▪MAx Moving average extension - ATR % multiple from the 50D SMA -Inspired by Jeff Sun
▪52WR - Measures where a security is trading in relation to it’s 52wk high and 52wk low. Readings near 100% indicate close proximity to a 52wk high and readings near 0% indicate close proximity to a 52wk low
▪Avg $Vol - Average volume (50 candles) * Price
▪Vol RR - Candle volume/ Avg candle volume
▪ Pristine Value Areas & MGI
▪ Pristine Fundamental Analysis
▪ Pristine Volume Analysis
💠 Signals Overview
▪HVY(highest volume in a year)-> Featured in Pristine Volume Analysis
▪Trend Template -> Inspired by Mark Minervini's famous trend filters
▪Rule of 100 -> Metrics from Pristine Fundamental Analysis
▪Bullish 80% Rule -> Featured in Pristine Value Areas & MGI
▪Bearish 80% Rule -> Featured in Pristine Value Areas & MGI
▪Break Above VAH -> Featured in Pristine Value Areas & MGI
▪Break Below VAL -> Featured in Pristine Value Areas & MGI
💠 Signals Decoded
▪HVY(highest volume in a year)
Volume is an important metric to track when trading, because abnormally high volume tends to occur when a new trend is kicking off, or when an established trend is hitting a climax. Screen for HVY to quickly curate every stock that meets this condition
▪Trend Template
Mark Minervini's gift to the trading world. Via his book "Think and Trade Like a Stock Market Wizard". Filter for trend template stocks using our tool.
▪Rule of 100
Pristine Capital's gift to the trading world. The rule of 100 filters for stocks that meet the following condition: YoY EPS Growth + YoY Sales Growth >= 100%
▪Bullish 80% Rule
If a security opens a period below the value area low, and subsequently closes above it, the bullish 80% rule triggers, turning the value area green. One can trade for a move to the top of the value area, using a close below the value area low as a potential stop!
In the below example, HOOD triggered the bullish 80% rule after it reclaimed the monthly value area!
HOOD proceeded to rally through the monthly value area and beyond in subsequent trading sessions. Finding the first stocks to trigger the bullish 80% rule after a market correction is key for spotting the next market leaders!
▪Bearish 80% Rule
If a security opens a period above the value area high, and subsequently closes below it, the bearish 80% rule triggers, turning the value area red. One can trade for a move to the bottom of the value area, using a close above the value area high as a potential stop!
ES proceeded to follow through and test the value area low before trending below the weekly value area
▪Break Above VAH
When a security is inside value, the auction is in balance. When it breaks above a value area, it could be entering a period of upward price discovery. One can trade these breakouts with tight risk control by setting a stop inside the value area! These breakouts can be traded on all chart timeframes depending on the style of the individual trader. Combining multiple timeframes can result in even more effective trading setups.
RBLX broke out from the monthly value area on 4/22/25👇
RBLX proceeded to rally +62.78% in 39 trading sessions following the monthly VAH breakout!
▪Break Below VAL
When a security is inside value, the auction is in balance. When it breaks below a value area, it could be entering a period of downward price discovery. One can trade these breakdowns with tight risk control by setting a stop inside the value area! These breakouts can be traded on all chart timeframes depending on the style of the individual trader. Combining multiple timeframes can result in even more effective trading setups.
CHWY broke below the monthly value area on 7/20/23👇
CHWY proceeded to decline -53.11% in the following 64 trading sessions following the monthly VAL breakdown!
💠 Metric Columns
▪%𝚫 - 1-day percent change in price
▪YTD %𝚫 - Year-to-date percent change in price
▪MTD %𝚫 - Month-to-date percent change in price
▪MAx Moving average extension - ATR % multiple from the 50D SMA -Inspired by Jeff Sun
▪52WR - Measures where a security is trading in relation to it’s 52wk high and 52wk low. Readings near 100% indicate close proximity to a 52wk high and readings near 0% indicate close proximity to a 52wk low
▪Avg $Vol - Average volume (50 candles) * Price
▪Vol RR - Candle volume/ Avg candle volume
초대 전용 스크립트
이 스크립트는 작성자가 승인한 사용자만 접근할 수 있습니다. 사용하려면 요청을 보내고 승인을 받아야 합니다. 일반적으로 결제 후에 승인이 이루어집니다. 자세한 내용은 아래 작성자의 지침을 따르거나 pristinecap에게 직접 문의하세요.
트레이딩뷰는 스크립트 작성자를 완전히 신뢰하고 스크립트 작동 방식을 이해하지 않는 한 스크립트 비용을 지불하거나 사용하지 않는 것을 권장하지 않습니다. 무료 오픈소스 대체 스크립트는 커뮤니티 스크립트에서 찾을 수 있습니다.
작성자 지시 사항
Access our tools here: tools.pristinecapital.net
Access our tools here: tools.pristinecapital.net
면책사항
이 정보와 게시물은 TradingView에서 제공하거나 보증하는 금융, 투자, 거래 또는 기타 유형의 조언이나 권고 사항을 의미하거나 구성하지 않습니다. 자세한 내용은 이용 약관을 참고하세요.