INVITE-ONLY SCRIPT
업데이트됨 Turbo Market Regime Detector [QuantAlgo]
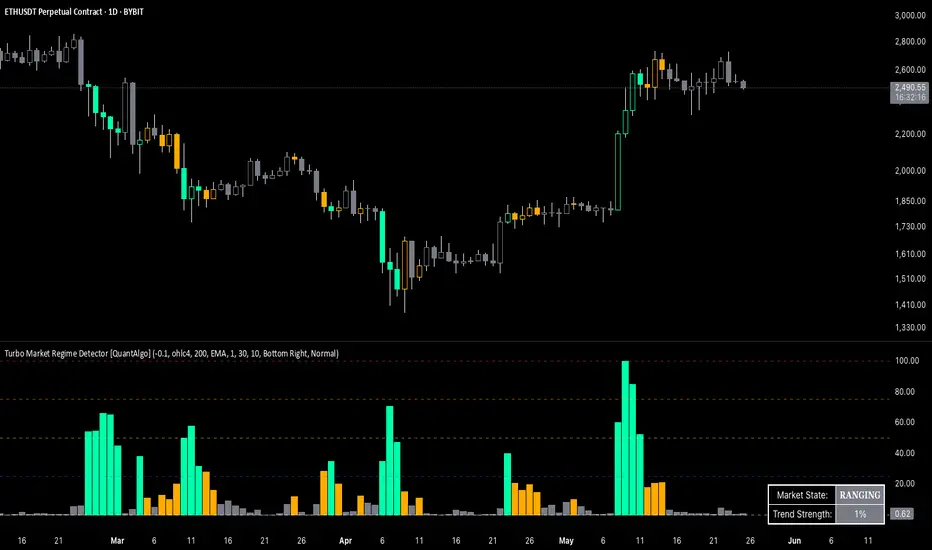
The Turbo Market Regime Detector is a market state classification system that combines volatility-adaptive filtering with slope analysis to identify and categorize market regimes. It helps traders and investors distinguish between trending and ranging market conditions across different timeframes and asset classes.
🟢 Technical Foundation
The Turbo Market Regime Detector employs a multi-layered analytical approach to market regime identification, incorporating:
The indicator processes price data through mathematical operations including volatility adjustment, slope normalization, and statistical range analysis. This creates a regime detection system that adapts to market volatility while maintaining classification consistency across different timeframes and asset classes.
🟢 Key Features & Signals
1. Market Regime Classification
The indicator presents market conditions through a normalized histogram that distinguishes between three distinct market states:
1/ Strong Trend Regime: When the histogram exceeds the strong trend threshold (default 30%), indicating directional market movement with sustained momentum

2/ Weak Trend Regime: When the histogram falls between weak trend (default 10%) and strong trend thresholds, representing transitional market conditions with moderate directional bias

3/ Ranging Regime: When the histogram remains below the weak trend threshold, signaling consolidation periods with limited directional movement

This classification system provides insights into:
→ Current market state with percentage-based quantification
→ Regime transitions and their timing
→ Market momentum strength across different timeframes
2. Visual Feedback System
The indicator features multiple visualization options for market analysis:
3. Alert and Notification System
The indicator generates alerts for regime transitions:
🟢 Practical Usage Guidelines

→ Regime-Based Strategy Selection: Use the indicator to identify potential trading strategies - trend-following during Strong Trend regimes, mean-reversion during Ranging periods, and adjusted position sizing during Weak Trend transitions
→ Multi-Timeframe Analysis: Apply the indicator across different timeframes to understand market regime hierarchy and identify confluence between short-term and long-term market states
→ Threshold Optimization: Adjust regime thresholds based on market volatility and asset characteristics - lower thresholds for more sensitive regime detection, higher thresholds for more definitive regime changes
🟢 Configuration Tips
VARF settings optimization:
→ Lower thresholds (-0.3 to -0.5) for more responsive regime detection in volatile markets
→ Higher thresholds (-0.1 to 0.1) for smoother signals in stable market conditions
→ Enable adaptive VARF for automatic volatility adjustment across different market cycles
Slope analysis parameter tuning:
→ Shorter MA lengths (100-200) for faster regime transition signals
→ Longer MA lengths (300-500) for more stable regime identification
→ Adjust sensitivity multiplier based on desired responsiveness vs. stability balance
Regime interpretation framework:
→ Strong Trend regimes for momentum-based strategies and trend following
→ Ranging regimes for mean-reversion and support/resistance trading
→ Weak Trend periods for reduced position sizing and cautious market approach
Complementary analysis integration:
→ Volume analysis for regime change confirmation
→ Support/resistance levels for entry/exit timing within regime contexts
→ Price action patterns for validation of regime-based trading decisions
→ Economic calendar events that may influence regime transitions
🟢 Technical Foundation
The Turbo Market Regime Detector employs a multi-layered analytical approach to market regime identification, incorporating:
- Volatility-Adaptive Regime Filter (VARF): Uses dynamic alpha calculation based on price volatility and range to create an adaptive filter that responds to changing market conditions
- Slope Analysis: Calculates the absolute slope of the VARF curve and applies customizable moving average smoothing to determine trend strength and market regime classification
- Normalized Histogram: Transforms raw slope data into percentage-based metrics (0-100%) for interpretation of market conditions
- Multi-Threshold Classification System: Implements user-defined thresholds to categorize markets into Strong Trend, Weak Trend, and Ranging regimes
The indicator processes price data through mathematical operations including volatility adjustment, slope normalization, and statistical range analysis. This creates a regime detection system that adapts to market volatility while maintaining classification consistency across different timeframes and asset classes.
🟢 Key Features & Signals
1. Market Regime Classification
The indicator presents market conditions through a normalized histogram that distinguishes between three distinct market states:
1/ Strong Trend Regime: When the histogram exceeds the strong trend threshold (default 30%), indicating directional market movement with sustained momentum
2/ Weak Trend Regime: When the histogram falls between weak trend (default 10%) and strong trend thresholds, representing transitional market conditions with moderate directional bias
3/ Ranging Regime: When the histogram remains below the weak trend threshold, signaling consolidation periods with limited directional movement
This classification system provides insights into:
→ Current market state with percentage-based quantification
→ Regime transitions and their timing
→ Market momentum strength across different timeframes
2. Visual Feedback System
The indicator features multiple visualization options for market analysis:
- Background Coloring: Optional chart background coloring that applies regime-based colors to both the indicator pane and main price chart for visual context
- Bar Coloring: Price bar coloring based on current market regime, providing visual feedback on market conditions
- Reference Lines: Horizontal reference lines at 25%, 50%, 75%, and 100% levels for percentage assessment and historical comparison
- Information Table: Real-time status display showing current market state and trend strength percentage with customizable positioning and sizing options
3. Alert and Notification System
The indicator generates alerts for regime transitions:
- State Change Alerts: Notifications triggered when the market transitions between regime states (Strong Trend ↔ Weak Trend ↔ Ranging)
- Specific Regime Entry Alerts: Individual alert conditions for entering Strong Trend, Weak Trend, or Ranging regimes for targeted trading strategies
- Customizable Alert Messages: Pre-formatted alert messages including exchange and ticker information for context and decision-making
🟢 Practical Usage Guidelines
→ Regime-Based Strategy Selection: Use the indicator to identify potential trading strategies - trend-following during Strong Trend regimes, mean-reversion during Ranging periods, and adjusted position sizing during Weak Trend transitions
→ Multi-Timeframe Analysis: Apply the indicator across different timeframes to understand market regime hierarchy and identify confluence between short-term and long-term market states
→ Threshold Optimization: Adjust regime thresholds based on market volatility and asset characteristics - lower thresholds for more sensitive regime detection, higher thresholds for more definitive regime changes
🟢 Configuration Tips
VARF settings optimization:
→ Lower thresholds (-0.3 to -0.5) for more responsive regime detection in volatile markets
→ Higher thresholds (-0.1 to 0.1) for smoother signals in stable market conditions
→ Enable adaptive VARF for automatic volatility adjustment across different market cycles
Slope analysis parameter tuning:
→ Shorter MA lengths (100-200) for faster regime transition signals
→ Longer MA lengths (300-500) for more stable regime identification
→ Adjust sensitivity multiplier based on desired responsiveness vs. stability balance
Regime interpretation framework:
→ Strong Trend regimes for momentum-based strategies and trend following
→ Ranging regimes for mean-reversion and support/resistance trading
→ Weak Trend periods for reduced position sizing and cautious market approach
Complementary analysis integration:
→ Volume analysis for regime change confirmation
→ Support/resistance levels for entry/exit timing within regime contexts
→ Price action patterns for validation of regime-based trading decisions
→ Economic calendar events that may influence regime transitions
릴리즈 노트
Updated parameters.초대 전용 스크립트
이 스크립트는 작성자가 승인한 사용자만 접근할 수 있습니다. 사용하려면 요청 후 승인을 받아야 하며, 일반적으로 결제 후에 허가가 부여됩니다. 자세한 내용은 아래 작성자의 안내를 따르거나 QuantAlgo에게 직접 문의하세요.
트레이딩뷰는 스크립트의 작동 방식을 충분히 이해하고 작성자를 완전히 신뢰하지 않는 이상, 해당 스크립트에 비용을 지불하거나 사용하는 것을 권장하지 않습니다. 커뮤니티 스크립트에서 무료 오픈소스 대안을 찾아보실 수도 있습니다.
작성자 지시 사항
👉 Access here: https://whop.com/quantalgo/
💰 Use code PREMIUM50 for 50% off first payment. Offer ends soon.
🎁🎄 Christmas SALE 50% Off with code XMAS50 (ends Dec 28) at whop.com/quantalgo/
📩 DM if you need any custom-built indicators or strategies.
📩 DM if you need any custom-built indicators or strategies.
면책사항
해당 정보와 게시물은 금융, 투자, 트레이딩 또는 기타 유형의 조언이나 권장 사항으로 간주되지 않으며, 트레이딩뷰에서 제공하거나 보증하는 것이 아닙니다. 자세한 내용은 이용 약관을 참조하세요.
초대 전용 스크립트
이 스크립트는 작성자가 승인한 사용자만 접근할 수 있습니다. 사용하려면 요청 후 승인을 받아야 하며, 일반적으로 결제 후에 허가가 부여됩니다. 자세한 내용은 아래 작성자의 안내를 따르거나 QuantAlgo에게 직접 문의하세요.
트레이딩뷰는 스크립트의 작동 방식을 충분히 이해하고 작성자를 완전히 신뢰하지 않는 이상, 해당 스크립트에 비용을 지불하거나 사용하는 것을 권장하지 않습니다. 커뮤니티 스크립트에서 무료 오픈소스 대안을 찾아보실 수도 있습니다.
작성자 지시 사항
👉 Access here: https://whop.com/quantalgo/
💰 Use code PREMIUM50 for 50% off first payment. Offer ends soon.
🎁🎄 Christmas SALE 50% Off with code XMAS50 (ends Dec 28) at whop.com/quantalgo/
📩 DM if you need any custom-built indicators or strategies.
📩 DM if you need any custom-built indicators or strategies.
면책사항
해당 정보와 게시물은 금융, 투자, 트레이딩 또는 기타 유형의 조언이나 권장 사항으로 간주되지 않으며, 트레이딩뷰에서 제공하거나 보증하는 것이 아닙니다. 자세한 내용은 이용 약관을 참조하세요.