OPEN-SOURCE SCRIPT
Spread Analysis (COIN/BTC)
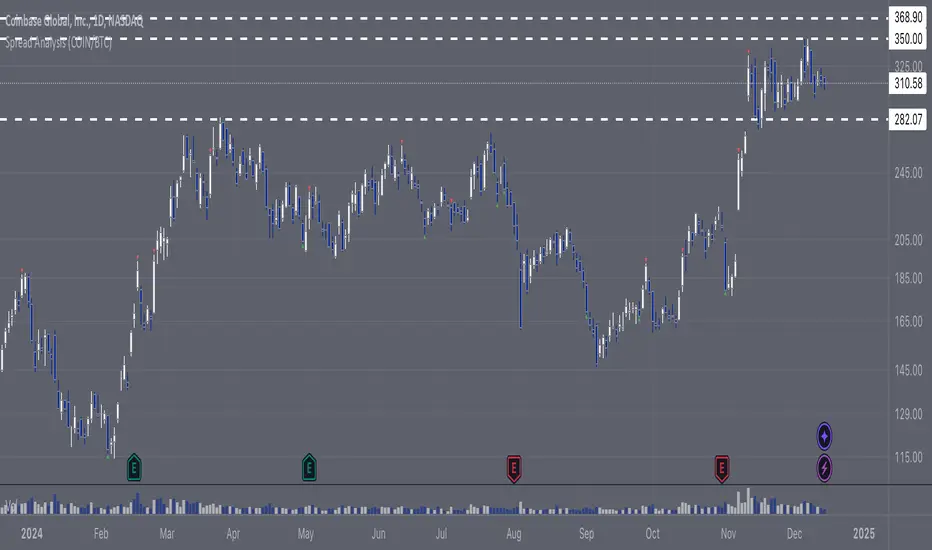
The Spread Analysis (COIN/BTC) indicator calculates the Z-score of the price ratio between Coinbase stock ( COIN) and Bitcoin (
 BTC). It helps identify overbought or oversold conditions based on deviations from the historical mean of their price relationship.
Key Features:
Z-Score Calculation:
• Tracks the relative price ratio ofCOIN to $BTC.
• Compares the current ratio to its historical average, highlighting extreme overvaluation or undervaluation.
• Buy and Sell Signals:
• Buy Signal: Triggered when the Z-score is less than -2, indicatingCOIN may be undervalued relative to $BTC.
• Sell Signal: Triggered when the Z-score exceeds 2, suggestingCOIN may be overvalued relative to $BTC.
• Dynamic Z-Score Visualization:
• Blue line plots the Z-score over time.
• Dashed lines at +2 and -2 mark overbought and oversold thresholds.
• Green and red triangles highlight actionable buy and sell signals.
Use Case:
This indicator is ideal for identifying relative valuation opportunities betweenCOIN and $BTC. Use it to exploit divergences in their historical relationship and anticipate potential reversions to the mean.
Limitations:
• Best suited for range-bound markets; may produce false signals in strongly trending conditions.
• Assumes a consistent correlation betweenCOIN and BTC, which may break during independent price drivers like news or earnings.
Key Features:
Z-Score Calculation:
• Tracks the relative price ratio of
• Compares the current ratio to its historical average, highlighting extreme overvaluation or undervaluation.
• Buy and Sell Signals:
• Buy Signal: Triggered when the Z-score is less than -2, indicating
• Sell Signal: Triggered when the Z-score exceeds 2, suggesting
• Dynamic Z-Score Visualization:
• Blue line plots the Z-score over time.
• Dashed lines at +2 and -2 mark overbought and oversold thresholds.
• Green and red triangles highlight actionable buy and sell signals.
Use Case:
This indicator is ideal for identifying relative valuation opportunities between
Limitations:
• Best suited for range-bound markets; may produce false signals in strongly trending conditions.
• Assumes a consistent correlation between
오픈 소스 스크립트
트레이딩뷰의 진정한 정신에 따라, 이 스크립트의 작성자는 이를 오픈소스로 공개하여 트레이더들이 기능을 검토하고 검증할 수 있도록 했습니다. 작성자에게 찬사를 보냅니다! 이 코드는 무료로 사용할 수 있지만, 코드를 재게시하는 경우 하우스 룰이 적용된다는 점을 기억하세요.
면책사항
해당 정보와 게시물은 금융, 투자, 트레이딩 또는 기타 유형의 조언이나 권장 사항으로 간주되지 않으며, 트레이딩뷰에서 제공하거나 보증하는 것이 아닙니다. 자세한 내용은 이용 약관을 참조하세요.
오픈 소스 스크립트
트레이딩뷰의 진정한 정신에 따라, 이 스크립트의 작성자는 이를 오픈소스로 공개하여 트레이더들이 기능을 검토하고 검증할 수 있도록 했습니다. 작성자에게 찬사를 보냅니다! 이 코드는 무료로 사용할 수 있지만, 코드를 재게시하는 경우 하우스 룰이 적용된다는 점을 기억하세요.
면책사항
해당 정보와 게시물은 금융, 투자, 트레이딩 또는 기타 유형의 조언이나 권장 사항으로 간주되지 않으며, 트레이딩뷰에서 제공하거나 보증하는 것이 아닙니다. 자세한 내용은 이용 약관을 참조하세요.