INVITE-ONLY SCRIPT
ICT AMD
What the indicator does
This indicator, named "ICT AMD indicator", is designed for traders who follow the ICT (Inner Circle Trader) theory, focusing on identifying and visualizing phases of market structure related to Accumulation, Manipulation, and Distribution. These phases are crucial for understanding the market's direction and potential turning points. The indicator:
How the indicator does it
The indicator implements its functionality through a series of calculated steps and conditions:
How traders can use it
Traders can leverage the "ICT AMD indicator" to enhance their market analysis and decision-making process:
By understanding and utilizing the visual and analytical insights provided by the "ICT AMD indicator", traders can potentially improve their trading outcomes by aligning their strategies with the underlying market dynamics it reveals.
This indicator, named "ICT AMD indicator", is designed for traders who follow the ICT (Inner Circle Trader) theory, focusing on identifying and visualizing phases of market structure related to Accumulation, Manipulation, and Distribution. These phases are crucial for understanding the market's direction and potential turning points. The indicator:
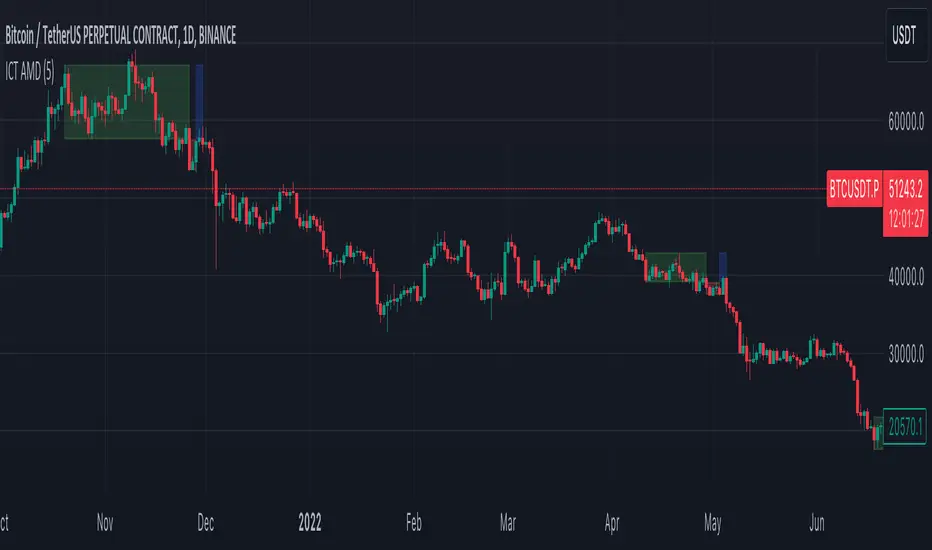
- Draws boxes on the chart to represent Accumulation, Manipulation, and Distribution areas, providing a visual representation of these key market phases.
- Highlights areas where the market is likely accumulating assets before a big move, manipulating prices to trigger retail stop losses, and distributing assets after a significant price move.
How the indicator does it
The indicator implements its functionality through a series of calculated steps and conditions:
- Utilizes pivot points to identify potential swing highs and lows within the market, which serve as the basis for determining the phases of Accumulation, Manipulation, and Distribution.
- Allows users to customize the pivot range and whether to include wicks in the pivot calculation, giving flexibility in identifying swing points based on personal trading style or strategy.
- Creates visual boxes on the chart where these phases are identified:
Accumulation boxes are drawn when the market is perceived to be gathering assets, indicated by a specific price behavior around swing lows.
Manipulation boxes appear around price levels where the market is likely pushing beyond key accumulation or distribution zones, possibly to trigger stop-loss orders.
Distribution boxes are established following the manipulation phase, indicating areas where the market is offloading assets post-accumulation.
- Adjusts the right edge of these boxes as new price information becomes available, ensuring they remain relevant and accurate to current market conditions.
- Employs color coding (green for Accumulation, red for Manipulation, and blue for Distribution) to make the distinction between different market phases clear and intuitive.
How traders can use it
Traders can leverage the "ICT AMD indicator" to enhance their market analysis and decision-making process:
- Identify potential entry and exit points by observing the transitions between Accumulation, Manipulation, and Distribution phases.
- Adjust their risk management strategies based on the identification of Manipulation areas, which could indicate areas of high stop-loss activity.
- Use the Accumulation and Distribution boxes to gauge the strength of a trend or potential reversal points, as these areas often precede significant market moves.
- Incorporate the indicator's insights with other analysis tools or indicators to confirm trade hypotheses or to refine entry and exit strategies.
- Apply the visual cues provided by the indicator to anticipate market moves based on historical patterns of Accumulation, Manipulation, and Distribution, aligning their trading strategies with the inferred market psychology.
By understanding and utilizing the visual and analytical insights provided by the "ICT AMD indicator", traders can potentially improve their trading outcomes by aligning their strategies with the underlying market dynamics it reveals.
초대 전용 스크립트
이 스크립트는 작성자가 승인한 사용자만 접근할 수 있습니다. 사용하려면 요청을 보내고 승인을 받아야 합니다. 일반적으로 결제 후에 승인이 이루어집니다. 자세한 내용은 아래 작성자의 지침을 따르거나 GreatestUsername에게 직접 문의하세요.
트레이딩뷰는 스크립트 작성자를 완전히 신뢰하고 스크립트 작동 방식을 이해하지 않는 한 스크립트 비용을 지불하거나 사용하지 않는 것을 권장하지 않습니다. 무료 오픈소스 대체 스크립트는 커뮤니티 스크립트에서 찾을 수 있습니다.
작성자 지시 사항
Go for gold
면책사항
이 정보와 게시물은 TradingView에서 제공하거나 보증하는 금융, 투자, 거래 또는 기타 유형의 조언이나 권고 사항을 의미하거나 구성하지 않습니다. 자세한 내용은 이용 약관을 참고하세요.