OPEN-SOURCE SCRIPT
EMA 20/50/100/200 Prices
Description:
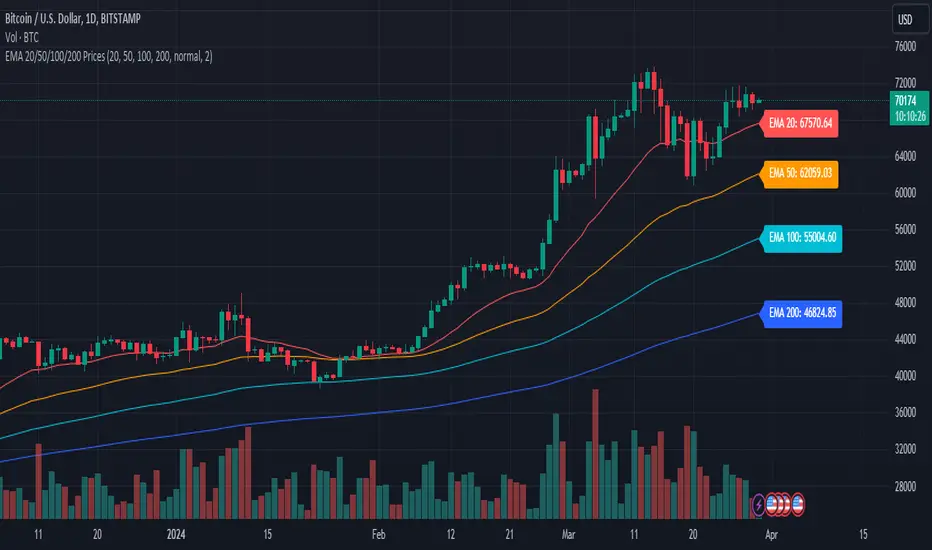
Introducing the EMA Indicator with Dynamic Labels, a unique addition to the TradingView Public Library. This innovative script enhances trend analysis and decision-making by overlaying four Exponential Moving Averages (EMAs) – 20, 50, 100, and 200 periods – on your chart, each with a distinct color for quick identification.
What sets this script apart?
Unlike standard EMA indicators, this script includes dynamic labels that display the current price level of each EMA at the latest price bar. This feature provides an instant snapshot of market sentiment, offering insights into potential dynamic support or resistance levels.
Key Features:
Customizable EMA Periods: Tailor the EMA periods according to your trading strategy, allowing for flexibility across different timeframes and assets.
Adaptive Label Sizes: A unique function adjusts label sizes based on user input, ensuring optimal readability across various display settings.
Color-Coded EMAs: Quickly differentiate between the EMAs with pre-defined colors, enhancing visual clarity and trend recognition.
How to Use:
Trend Analysis: Use the EMAs to identify the overall market trend. When shorter EMAs are above longer ones, it suggests a bullish trend, and vice versa.
Trade Entries and Exits: Look for crossovers of the EMAs as potential entry or exit signals. Dynamic labels will help you pinpoint the exact levels.
Customization: Adjust the EMA periods and label sizes under the indicator settings to match your trading style and preferences.
Underlying Concepts:
This script utilizes the classic EMA calculation but innovates by integrating dynamic, real-time labels and customizable periods. The choice of four different periods allows for a nuanced analysis of trend strength and direction, catering to both short-term traders and long-term investors.
Originality and Contribution:
The "Advanced EMA Indicator with Dynamic Labels" is original in its approach to providing real-time, actionable data through dynamic labels. It caters to the community's need for more interactive and informative indicators that go beyond basic trend analysis.
Conclusion:
Whether you're a novice trader seeking to understand market trends or an experienced investor looking for nuanced analysis tools, this script offers valuable insights and flexibility. It stands as a testament to the power of Pine Script in creating practical, user-centric trading tools.
오픈 소스 스크립트
트레이딩뷰의 진정한 정신에 따라, 이 스크립트의 작성자는 이를 오픈소스로 공개하여 트레이더들이 기능을 검토하고 검증할 수 있도록 했습니다. 작성자에게 찬사를 보냅니다! 이 코드는 무료로 사용할 수 있지만, 코드를 재게시하는 경우 하우스 룰이 적용된다는 점을 기억하세요.
면책사항
해당 정보와 게시물은 금융, 투자, 트레이딩 또는 기타 유형의 조언이나 권장 사항으로 간주되지 않으며, 트레이딩뷰에서 제공하거나 보증하는 것이 아닙니다. 자세한 내용은 이용 약관을 참조하세요.
오픈 소스 스크립트
트레이딩뷰의 진정한 정신에 따라, 이 스크립트의 작성자는 이를 오픈소스로 공개하여 트레이더들이 기능을 검토하고 검증할 수 있도록 했습니다. 작성자에게 찬사를 보냅니다! 이 코드는 무료로 사용할 수 있지만, 코드를 재게시하는 경우 하우스 룰이 적용된다는 점을 기억하세요.
면책사항
해당 정보와 게시물은 금융, 투자, 트레이딩 또는 기타 유형의 조언이나 권장 사항으로 간주되지 않으며, 트레이딩뷰에서 제공하거나 보증하는 것이 아닙니다. 자세한 내용은 이용 약관을 참조하세요.